| Followers | 680 |
| Posts | 141209 |
| Boards Moderated | 36 |
| Alias Born | 03/10/2004 |
Thursday, November 22, 2018 10:31:59 AM
By: Mike Paulenoff | November 21, 2018
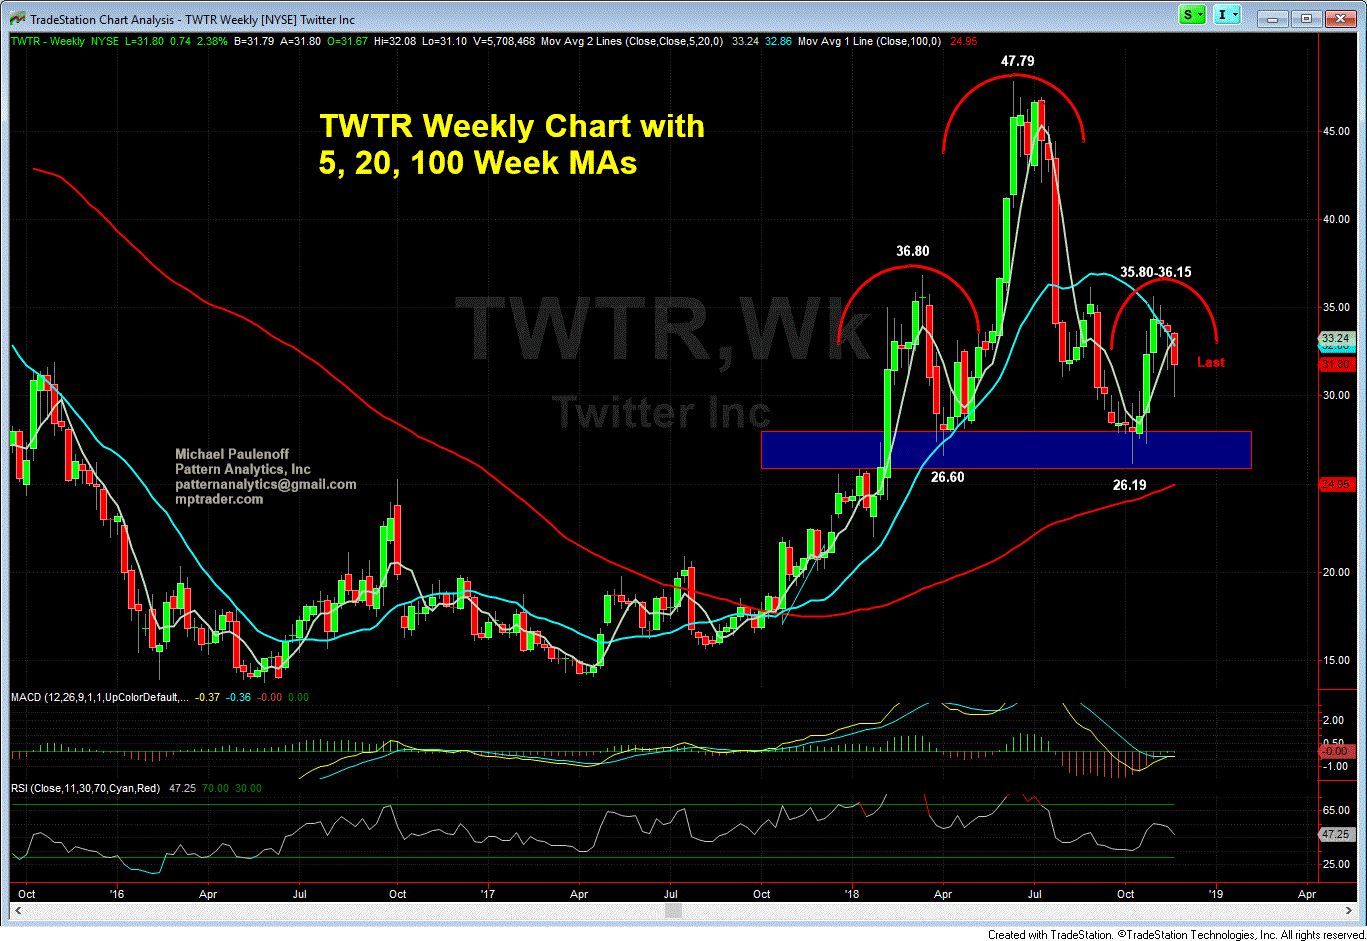
TWTR-- deserves and requires more than a one-liner. Wow, what a chart! My attached Weekly Chart shows a massive Head & Shoulders Top Formation that is in the process of carving out a Right Shoulder between 36 on the high side and 27 on the low side.
The implication from the pattern indicates that if for whatever reason TWTR declines beneath 26-27 support, it will be vulnerable to powerful forces of long liquidation that sends the stock towards 12-15 optimally, and possibly to SINGLE DIGITS thereafter.
If Left-Right Shoulder time symmetry is equal, then 10-12 weeks will be needed to complete the Right Shoulder, which means another 3-5 weeks from now, or mid-to-late December before TWTR will be extremely vulnerable to acute selling pressure.
Only a climb above 36-37 will invalidate the Top Formation...
Anyone have some thoughts about what conditions or fundamentals would send TWTR into an existential tailspin?

https://www.mptrader.com/middaymarkets/What-in-the-World-is-the-Longer-Term-TWTR-Chart-Telling-Us-Hint-Nothing-Good-20181121113979.html
• DiscoverGold
Information posted to this board is not meant to suggest any specific action, but to point out the technical signs that can help our readers make their own specific decisions. Your Due Dilegence is a must!
• DiscoverGold
Avant Technologies Equipping AI-Managed Data Center with High Performance Computing Systems • AVAI • May 10, 2024 8:00 AM
VAYK Discloses Strategic Conversation on Potential Acquisition of $4 Million Home Service Business • VAYK • May 9, 2024 9:00 AM
Bantec's Howco Awarded $4.19 Million Dollar U.S. Department of Defense Contract • BANT • May 8, 2024 10:00 AM
Element79 Gold Corp Successfully Closes Maverick Springs Option Agreement • ELEM • May 8, 2024 9:05 AM
Kona Gold Beverages, Inc. Achieves April Revenues Exceeding $586,000 • KGKG • May 8, 2024 8:30 AM
Epazz plans to spin off Galaxy Batteries Inc. • EPAZ • May 8, 2024 7:05 AM


