


| Followers | 689 |
| Posts | 143817 |
| Boards Moderated | 35 |
| Alias Born | 03/10/2004 |
Sunday, November 11, 2018 4:06:23 PM
CoT: Peek Into Future Through Futures, How Hedge Funds Are Positioned
By: Hedgopia | November 10, 2018
Following futures positions of non-commercials are as of November 6, 2018.
E-mini S&P 500: Currently net long 198k, down 65k.
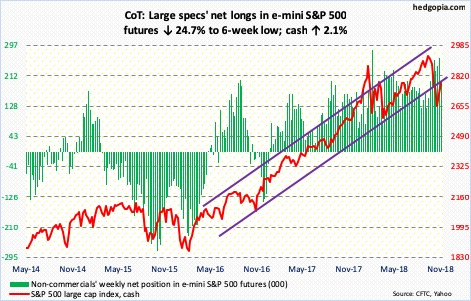
For the second time since mid-October, the cash (2781.01) was denied at just north of 2800. Wednesday’s post-election gap-up rallied the S&P 500 to 2815.15, and that was it. By Friday, it was testing the 200-day moving average, which is now ever so slightly dropping.
Inability to take out broken-support-turned-resistance at 2800, which also approximates the underside of a broken rising trend line from February 2016, is a sign bears are beginning to gain conviction. Right here also lies Fibonacci 0.618-retracement resistance of the drop between September 21 and October 29.
For now, the consolation for bulls is that the 200-day was defended during Friday’s 0.9-percent down session. But the daily chart seems to be itching to go lower. Our own Hedgopia Risk Reward Index just entered the red zone. Bulls have their work cut out – at least near term.
In the week to Wednesday, US-based equity funds (including ETF’s) lost $8.5 billion (courtesy of Lipper.com). SPY (SPDR S&P 500 ETF) lost $2.3 billion, even as IVV (iShares core S&P 500 ETF) took in $276 million and VOO (Vanguard S&P 500 ETF) $481 million (courtesy of ETF.com).
Nasdaq 100 index (mini): Currently net short 592, down 10.8k.
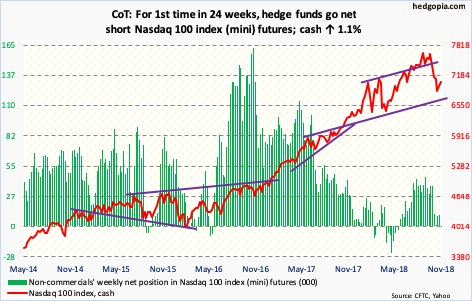
On October 17, rally attempts were rejected just north of 7300 on the cash (7039.15). The subsequent selloff bottomed at 6574.75 on the 29th, leading to a rally which culminated Wednesday just north of 7200, for a lower high.
Friday, the Nasdaq 100 sliced through the 200-day to drop 1.7 percent; it could have been worse had bulls not defended the 10-day. On the daily chart, there is room for the index to continue lower.
For the first time in 24 weeks, non-commercials went net short. In the week through Wednesday, QQQ (Invesco QQQ Trust) lost $1.9 billion (courtesy of ETF.com).
Russell 2000 mini-index: Currently net short 46.9k, up 13.9k.
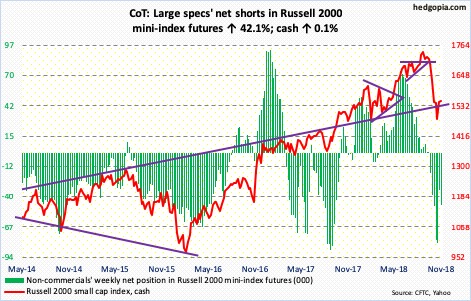
The cash (1549.49) essentially marked time this week, up only 0.1 percent. Bulls were unable to hold on to the gains, as the Russell 2000 at one point was up 2.5 percent for the week. This followed last week’s 4.3-percent jump. So either the index this week was digesting last week’s gains or this is a sign major horizontal support at 1610-ish is not going to give way easy. Perhaps it is the latter.
Thursday this week, the Russell 2000 managed to rally to 1586.17. This followed an earlier rally last month which stopped at 1598.01 on the 16th. Friday, small-cap bulls showed up at the 10- and 20-day, which are now converging. But they face an uphill task until the above resistance gets taken out. The 200-day (1616.20) lies around there as well.
In the week ended Wednesday, IWM (iShares Russell 2000 ETF) lost $1.5 billion, while IJR (iShares core S&P small-cap ETF) lost $357 million (courtesy of ETF.com). Non-commercials added to net shorts.
US Dollar Index: Currently net long 40.3k, up 759.
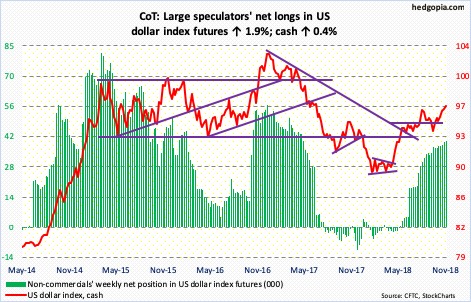
Once again Friday, dollar bulls had difficulty busting through resistance just south of 97, but are hanging in there. Mid-August, the cash (96.73) rose to an intraday high of 96.86 before reversing lower. Last week, the US dollar index rallied intraday to 96.98. This Friday, it rallied to 96.85 intraday. A breakout would add to momentum that has been in place since bottoming at 88-plus early this year.
VIX: Currently net long 13k, up 11k.
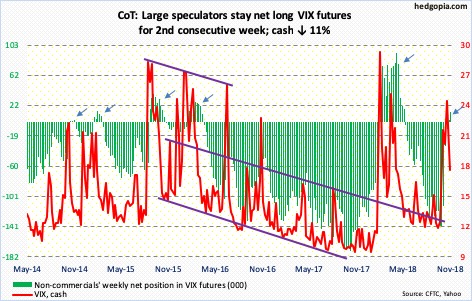
Like clockwork, the cash (17.36) began dropping as soon as non-commercials switched to net long last week. This week, they added more. Concurrently, there is room for both the VIX-to-VXV ratio and the 21-day moving average of the COBE equity-only put-to-call ratio to continue to unwind the overbought condition they are in, in which case volatility comes under more pressure. Several momentum indicators have already turned lower. The only problem is, the daily seems to want to rally. VIX is slightly above both the 50- and 200-day. Thus far, support at 15-16 has held. Thus, it is possible volatility rises in the very near term before the weekly takes over.
Read More »»»
• DiscoverGold
Click on "In reply to", for Authors past commentaries
Information posted to this board is not meant to suggest any specific action, but to point out the technical signs that can help our readers make their own specific decisions. Your Due Dilegence is a must!
• DiscoverGold
Join the InvestorsHub Community
Register for free to join our community of investors and share your ideas. You will also get access to streaming quotes, interactive charts, trades, portfolio, live options flow and more tools.

