Afternoon Sell-Off - Indicators Oversold, Not at Extremes By: Erin Swenlin | October 24, 2018
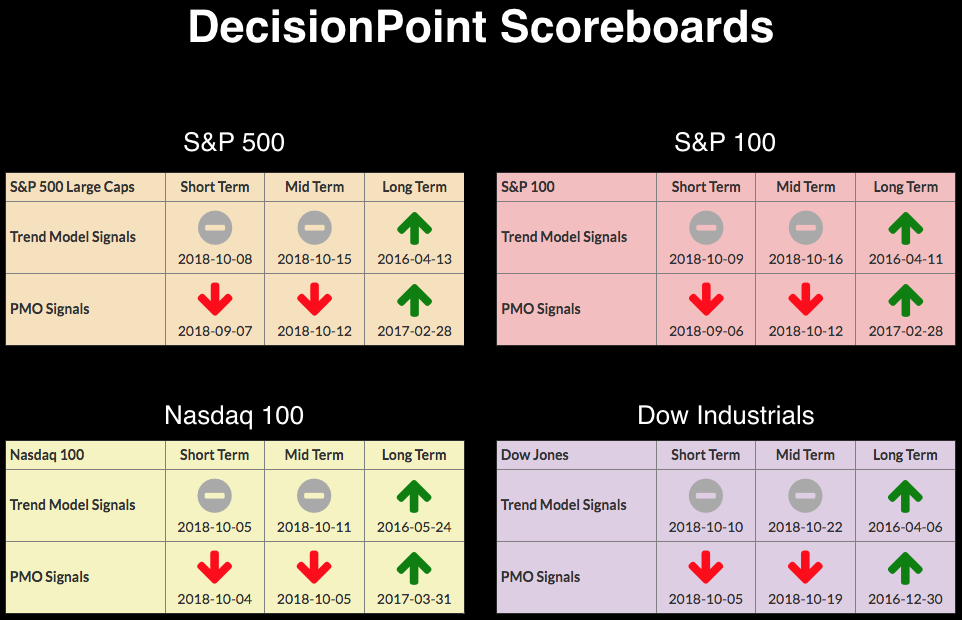
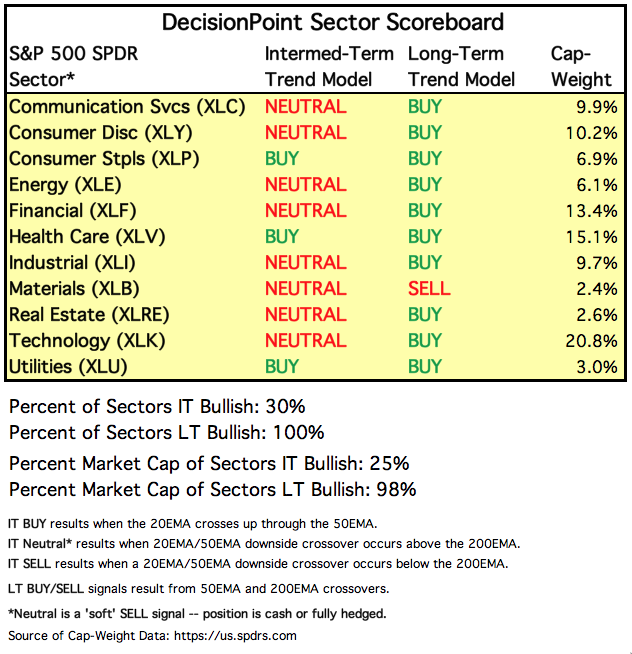
Today's sell-offs (over 3% on the SPX , almost 4.5% on the Nasdaq and 3.79% drop on the Russell 2000) were deep and painful, but you don't need me to tell you that. I would like to be the bearer of good news, but I can't find much out there. The DP Scoreboards display the weakness in the short and intermediate terms. The Sector Scoreboard, underneath the large index Scoreboards, shows that defensive sectors are the only ones with IT Buy signals.
SECTORS
Each S&P 500 Index component stock is assigned to one, and only one, of 11 major sectors. This is a snapshot of the Intermediate-Term and Long-Term Trend Model signal status for those sectors.
STOCKS
IT Trend Model: Neutral as of 10/15/2018
LT Trend Model: BUY as of 4/1/2016
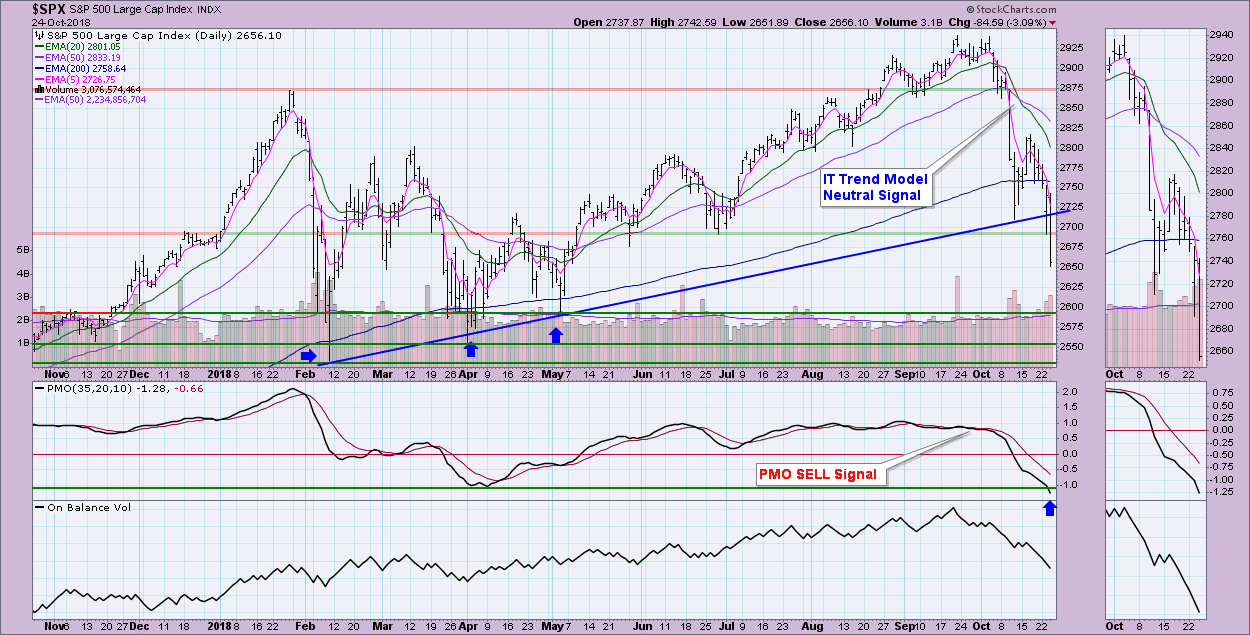
SPY Daily Chart: Yesterday saw the break in the rising trend, but it managed to close comfortably above it. Today trading occurred mostly below the rising trend and even below the June low. The PMO has now reached levels we haven't seen in over a year; and while that may look oversold, typically the SPX's PMO travels in a range of +2 to -2. With a reading of -1.28, we know that it isn't that oversold. Look at the OBV. Note the huge decline since the all-time high. The correction in February didn't see that kind of distribution by a mile. Unfortunately, that kind of weakness suggests further decline. I've marked a few different levels where we could see a reversal.
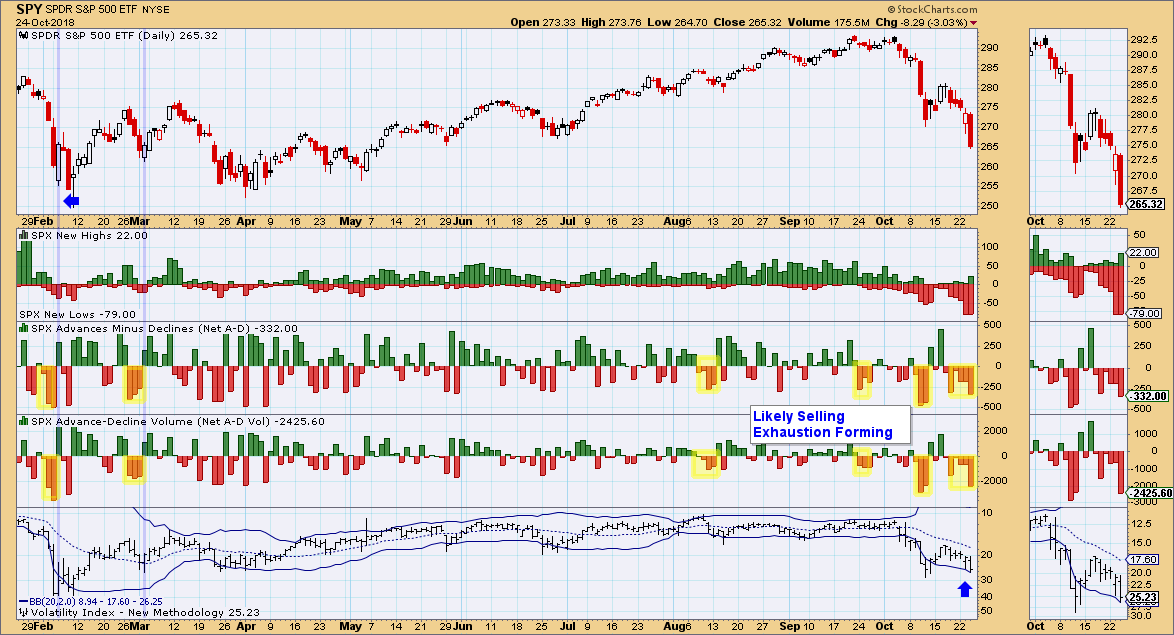
Climactic Market Indicators: With the high breadth readings, a selling exhaustion is ripening. We've seen more negative readings previously. If we see the VIX close below its Bollinger Band in the coming days, I'd look for a very short-lived bounce like we saw after the last exhaustion readings.
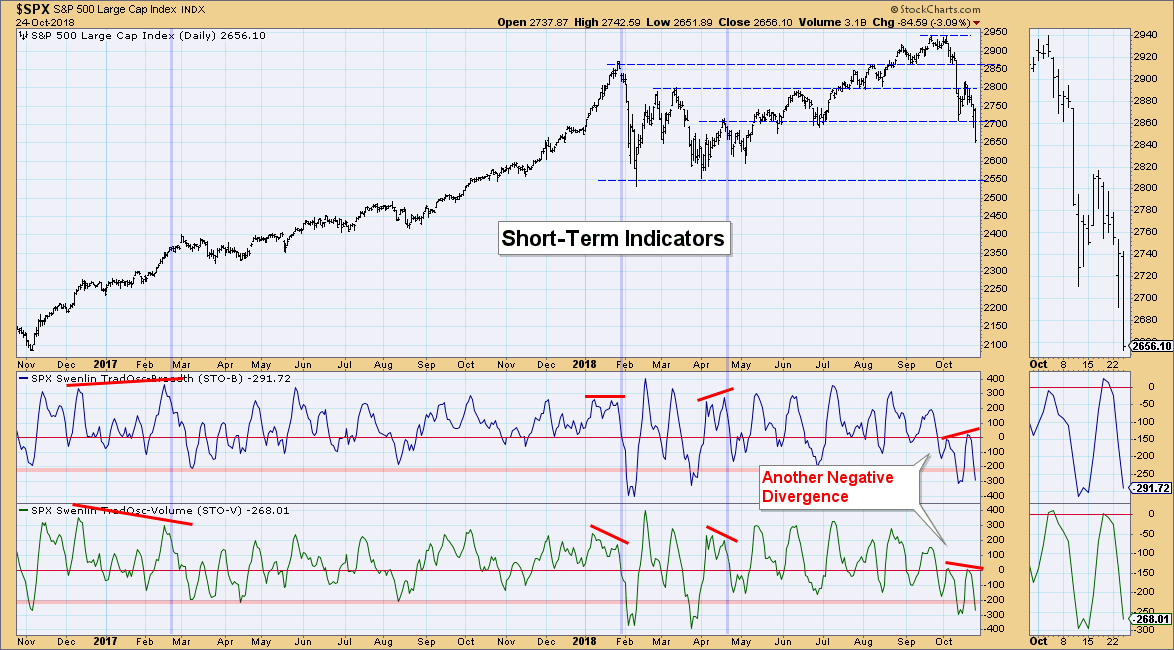
Short-Term Market Indicators: We only got one day to spot the negative divergence on the STO tops and unfortunately I didn't spot it until today. Normally I would look at the oversold readings on this chart and look for a higher prices, but we saw readings well-below today's after the last correction. That tells me we are vulnerable for more downside in the short-term.
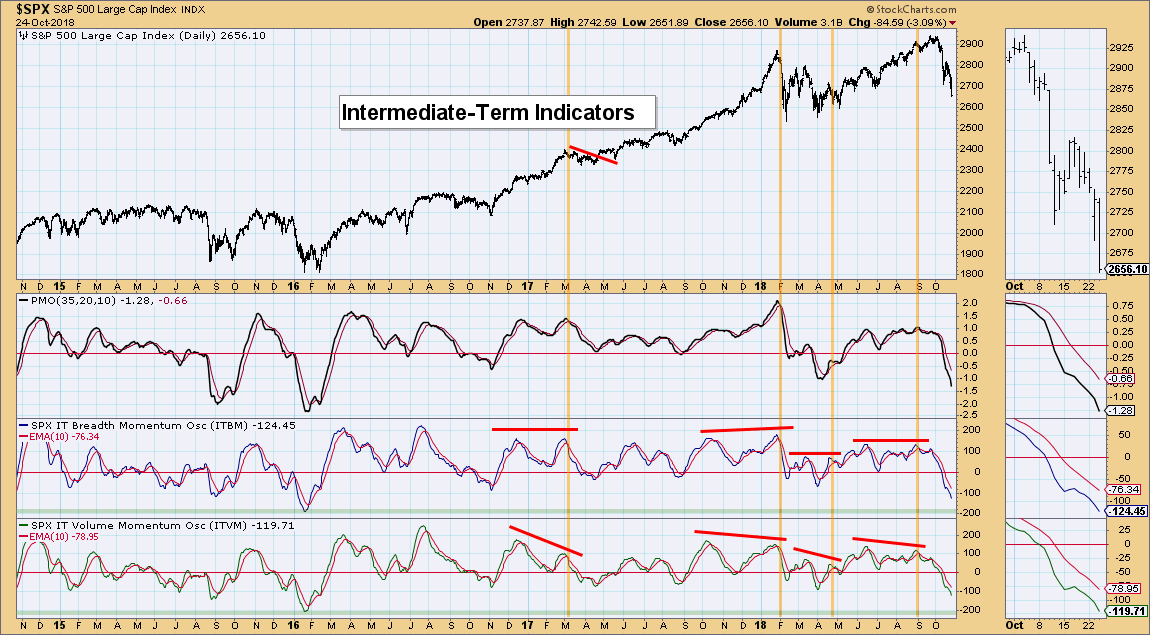
Intermediate-Term Market Indicators: These indicators are very oversold, but not at extremes. They are also accelerating lower.
Conclusion: Normally I would be excited to see so many oversold indicators, but looking at the last correction in Jan/Feb, I note that they reached lower levels with the exception of the intermediate-term indicators. They have reached past the last correction's readings, but not past 2016 extremes. They can accommodate more downside.
Information posted to this board is not meant to suggest any specific action, but to point out the technical signs that can help our readers make their own specific decisions. Your Due Dilegence is a must! • DiscoverGold
Register for free to join our community of investors and share your ideas. You will also get access to streaming quotes, interactive charts, trades, portfolio, live options flow and more tools.


 News
News  Market Data
  Discover