


| Followers | 689 |
| Posts | 143817 |
| Boards Moderated | 35 |
| Alias Born | 03/10/2004 |
Monday, October 22, 2018 9:26:14 AM
Stocks Could Be Near a Bottom, Says One Options Signal
By: Schaeffer's Investment Research | October 22, 2018
How to (carefully!) play a negative sentiment extreme in the options market
Wait for these signs to confirm that the risk-reward scenario is tilted back in the bulls' favor
Last week was volatile, and once again it was likely the expiration of standard October options that helped spur along such volatility. The SPDR S&P 500 ETF Trust (SPY - 276.25) started the week off by showing some stability, holding above the put-heavy 272 and 275 strikes, which were mentioned specifically in last week's report as important levels from both a chart and options-related perspective.
Tuesday's action was a near mirror-image of the selling that took place in the prior week. The SPY moved higher to start the day and continued to advance into the close. One theory as to why this occurred is that more and more short positions associated with the out-of-the-money 272 and 275 strikes were likely covered throughout the day, as those options grew less sensitive to SPY movement (due to a combination of those options nearing expiration and the SPY moving further above these strikes as short covering persisted in the futures market). In other words, as I speculated could happen, the opposite forces from the prior week proved supportive.
The SPY eventually pushed above the put-heavy 280 strike, but geopolitical tensions surfaced related to Saudi Arabia and Europe (both Italy and Brexit). The headlines pushed stocks lower, and with the SPY moving back below the 280 strike, delta-hedge selling likely accelerated the decline on Thursday, as short positions associated with this strike were re-established.
Amid the sharp daily moves last week driven by geopolitical headlines and standard options expiration week, there was little net movement. In fact, the S&P 500 Index's (SPX - 2,767.78) range was 67 points last week from low to high, and the close was only 0.65 point above the previous Friday's close.

In addition to the SPY holding support at its May breakout area and the $275 level -- which equates to the half-century 2,750 mark on the SPX -- the Cboe Volatility Index (VIX - 19.89) retreated from 25.15, half this year's intraday high. However, the negatives from these vantage points are equally important, as the SPY failed to hold above $280, equivalent to the SPX's 2,800 century mark, and the VIX closed above 18.66, which is half its 2018 closing high. So while the equities market stabilized last week, it is not yet out of the woods.
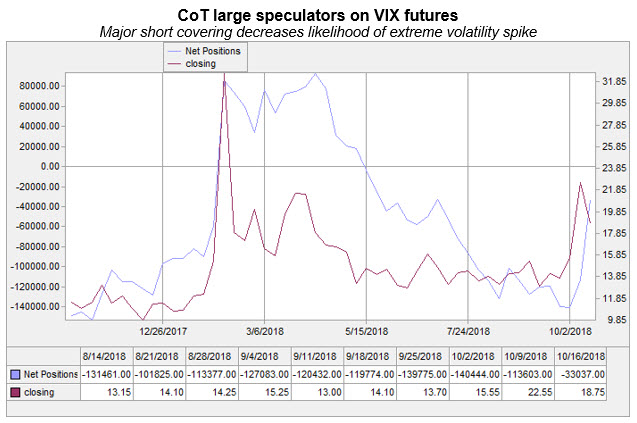
"We could see a surge in volatility, as the 'wrong-way' Commitments of Traders (CoT) large speculators are still net short Cboe Volatility Index (VIX) futures."
-- Monday Morning Outlook, October 1, 2018
Above said, I think there is a good chance we have seen the worst of the volatility spike. The latest Commitments of Traders (CoT) data showed that there was significant covering among large speculators in the short VIX futures trade. Given this group's poor track record on trading volatility futures, the short-covering activity decreases the odds of a major volatility surge that I had been warning of prior to this most recent spike.
"Amid the current sentiment backdrop and on the heels of last week's monetary policy decision, there would appear to be slightly more risk than reward in the market's short-term status... For example, the 10-day equity-only, buy-to-open put/call volume ratio gives us a unique glimpse into the real-time sentiment of traders... when the put/call volume ratio is low in general, the SPY has struggled, even after the Fed paused in late January."
-- Monday Morning Outlook, October 1, 2018
Todd Salamone
@toddsalamone
Our equity-only, buy (to open) put/call volume indicator is at highest level since May and around the levels that marked bottom in Feb-March correction $SPX pic.twitter.com/pEkcx8AjS7
10:28 AM - Oct 17, 2018
48
20 people are talking about this
Twitter Ads info and privacy
With yet another hangover in equities following the late-September rate hike (no surprise, based on historical price action in the month following rates hikes since December 2015), geopolitical concerns firing up again, and uncertainty related to next month's midterm elections, traders -- specifically, equity option buyers -- have suddenly soured on the market. It should be mentioned that this group had a positive bias just ahead of the late-September rate hike, even though the expected rate hike meant equities were likely to struggle.
In the middle of last week, in reaction to the sell-off, this group was buying equity put options relative to call options at a rate similar to that which marked the bottom of the February and March correction. By the end of the week, this ratio climbed to its highest level since August 2017. For bulls, this implies the sentiment backdrop, based on recent history, is negative enough to suggest we have either reached a bottom or are near a bottom.

But you have to be careful with sentiment indicators, as extremes can become more extreme. Therefore, we prefer to see a roll-over in the equity-only, buy-to-open put/call volume ratio before declaring the risk-reward scenario is favoring the bulls. Such patience likely means you will not catch the exact bottom, but it will also keep you out of situations like last week, in which bounces prove only temporary. Coincident with a roll-over in this ratio from a relatively high level, like we're seeing now, I would like to see the VIX below 18.66 and the SPY and SPX above $280 and 2,800, respectively.
If you want to play the negative sentiment extreme in the options market, I would recommend doing so with smaller dollars and then slowly wading in if the indicators discussed above give you "permission" to commit more capital to the long side. One way to do this is buying call options, so that you can leverage your bet with fewer dollars at risk relative to buying the underlying vehicle, whether that be an equity exchange-traded fund (ETF) or a stock.
While equity option buyers are displaying an extreme in pessimism, note in the graph below that SPX component short interest is moving higher from a relatively low level. Unlike option data that is real-time, short interest data is released only twice a month on a two-week delay. The data in the graph is as of Oct. 1, and the Oct. 15 data from the exchanges will be released later this month. At that point, bulls would like to see a spike in short interest similar to that which occurred during the correction early in the year. Stay tuned for updates.

In the meantime, the best course of action to play this environment is to have exposure on both sides of the market, as there is risk. There has certainly been enough technical damage on some equities to warrant short positions, or better yet, put purchases. At the same time, there are other stocks pulling back to support that could be worthwhile opportunities on the long side.
Read More »»»
• DiscoverGold
By: Schaeffer's Investment Research | October 22, 2018
How to (carefully!) play a negative sentiment extreme in the options market
Wait for these signs to confirm that the risk-reward scenario is tilted back in the bulls' favor
Last week was volatile, and once again it was likely the expiration of standard October options that helped spur along such volatility. The SPDR S&P 500 ETF Trust (SPY - 276.25) started the week off by showing some stability, holding above the put-heavy 272 and 275 strikes, which were mentioned specifically in last week's report as important levels from both a chart and options-related perspective.
Tuesday's action was a near mirror-image of the selling that took place in the prior week. The SPY moved higher to start the day and continued to advance into the close. One theory as to why this occurred is that more and more short positions associated with the out-of-the-money 272 and 275 strikes were likely covered throughout the day, as those options grew less sensitive to SPY movement (due to a combination of those options nearing expiration and the SPY moving further above these strikes as short covering persisted in the futures market). In other words, as I speculated could happen, the opposite forces from the prior week proved supportive.
The SPY eventually pushed above the put-heavy 280 strike, but geopolitical tensions surfaced related to Saudi Arabia and Europe (both Italy and Brexit). The headlines pushed stocks lower, and with the SPY moving back below the 280 strike, delta-hedge selling likely accelerated the decline on Thursday, as short positions associated with this strike were re-established.
Amid the sharp daily moves last week driven by geopolitical headlines and standard options expiration week, there was little net movement. In fact, the S&P 500 Index's (SPX - 2,767.78) range was 67 points last week from low to high, and the close was only 0.65 point above the previous Friday's close.

In addition to the SPY holding support at its May breakout area and the $275 level -- which equates to the half-century 2,750 mark on the SPX -- the Cboe Volatility Index (VIX - 19.89) retreated from 25.15, half this year's intraday high. However, the negatives from these vantage points are equally important, as the SPY failed to hold above $280, equivalent to the SPX's 2,800 century mark, and the VIX closed above 18.66, which is half its 2018 closing high. So while the equities market stabilized last week, it is not yet out of the woods.
"We could see a surge in volatility, as the 'wrong-way' Commitments of Traders (CoT) large speculators are still net short Cboe Volatility Index (VIX) futures."
-- Monday Morning Outlook, October 1, 2018
Above said, I think there is a good chance we have seen the worst of the volatility spike. The latest Commitments of Traders (CoT) data showed that there was significant covering among large speculators in the short VIX futures trade. Given this group's poor track record on trading volatility futures, the short-covering activity decreases the odds of a major volatility surge that I had been warning of prior to this most recent spike.

"Amid the current sentiment backdrop and on the heels of last week's monetary policy decision, there would appear to be slightly more risk than reward in the market's short-term status... For example, the 10-day equity-only, buy-to-open put/call volume ratio gives us a unique glimpse into the real-time sentiment of traders... when the put/call volume ratio is low in general, the SPY has struggled, even after the Fed paused in late January."
-- Monday Morning Outlook, October 1, 2018
Todd Salamone
@toddsalamone
Our equity-only, buy (to open) put/call volume indicator is at highest level since May and around the levels that marked bottom in Feb-March correction $SPX pic.twitter.com/pEkcx8AjS7
10:28 AM - Oct 17, 2018
48
20 people are talking about this
Twitter Ads info and privacy
With yet another hangover in equities following the late-September rate hike (no surprise, based on historical price action in the month following rates hikes since December 2015), geopolitical concerns firing up again, and uncertainty related to next month's midterm elections, traders -- specifically, equity option buyers -- have suddenly soured on the market. It should be mentioned that this group had a positive bias just ahead of the late-September rate hike, even though the expected rate hike meant equities were likely to struggle.
In the middle of last week, in reaction to the sell-off, this group was buying equity put options relative to call options at a rate similar to that which marked the bottom of the February and March correction. By the end of the week, this ratio climbed to its highest level since August 2017. For bulls, this implies the sentiment backdrop, based on recent history, is negative enough to suggest we have either reached a bottom or are near a bottom.

But you have to be careful with sentiment indicators, as extremes can become more extreme. Therefore, we prefer to see a roll-over in the equity-only, buy-to-open put/call volume ratio before declaring the risk-reward scenario is favoring the bulls. Such patience likely means you will not catch the exact bottom, but it will also keep you out of situations like last week, in which bounces prove only temporary. Coincident with a roll-over in this ratio from a relatively high level, like we're seeing now, I would like to see the VIX below 18.66 and the SPY and SPX above $280 and 2,800, respectively.
If you want to play the negative sentiment extreme in the options market, I would recommend doing so with smaller dollars and then slowly wading in if the indicators discussed above give you "permission" to commit more capital to the long side. One way to do this is buying call options, so that you can leverage your bet with fewer dollars at risk relative to buying the underlying vehicle, whether that be an equity exchange-traded fund (ETF) or a stock.
While equity option buyers are displaying an extreme in pessimism, note in the graph below that SPX component short interest is moving higher from a relatively low level. Unlike option data that is real-time, short interest data is released only twice a month on a two-week delay. The data in the graph is as of Oct. 1, and the Oct. 15 data from the exchanges will be released later this month. At that point, bulls would like to see a spike in short interest similar to that which occurred during the correction early in the year. Stay tuned for updates.

In the meantime, the best course of action to play this environment is to have exposure on both sides of the market, as there is risk. There has certainly been enough technical damage on some equities to warrant short positions, or better yet, put purchases. At the same time, there are other stocks pulling back to support that could be worthwhile opportunities on the long side.
Read More »»»
• DiscoverGold
Information posted to this board is not meant to suggest any specific action, but to point out the technical signs that can help our readers make their own specific decisions. Your Due Dilegence is a must!
• DiscoverGold
Join the InvestorsHub Community
Register for free to join our community of investors and share your ideas. You will also get access to streaming quotes, interactive charts, trades, portfolio, live options flow and more tools.

