DP (SPY) Weekly Wrap: Bear Market Yet? Waiting for Retest By: Carl Swenlin | October 19, 2018
Despite a great rally on Tuesday, a sharp decline on Thursday took it all back, and the market finished the week barely changed. This was an options expiration week, so I think that probably had something to do with it. As of last week, I was expecting some chop in preparation for a retest of last week's low. Well, we got the chop, but I think the retest is yet to come, probably next week. We usually anticipate that a retest will result in a completed bottom, but that may not be the case this time.
SECTORS
Each S&P 500 Index component stock is assigned to one, and only one, of 11 major sectors. This is a snapshot of the Intermediate-Term and Long-Term Trend Model signal status for those sectors.
STOCKS
IT Trend Model: NEUTRAL as of 10/15/2018
LT Trend Model: BUY as of 4/1/2016
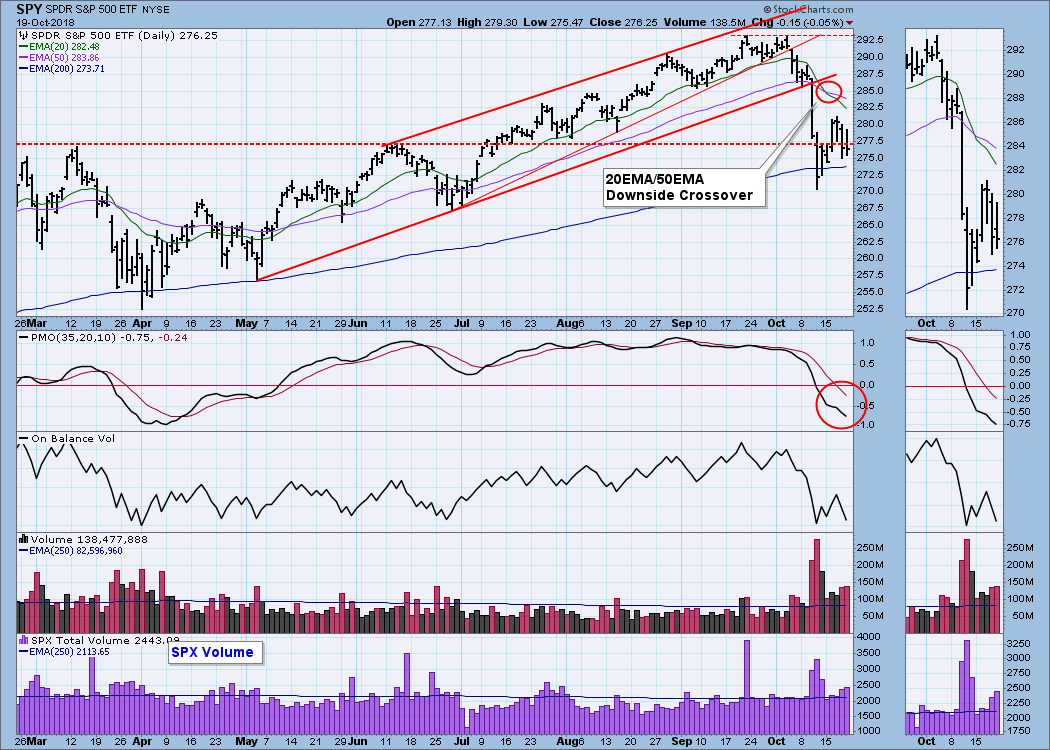
SPY Daily Chart: On Monday the IT Trend Model for SPY changed from BUY to NEUTRAL when the 20EMA crossed down through the 50EMA. A NEUTRAL signal is considered to be a soft SELL signal because the position would theoretically go from being long, then into cash or being fully hedged. A SELL signal (short) is only generated when the 20/50EMA crossover occurs when the 50EMA is below the 200EMA.
The VIX moved off the lower Bollinger Band, but it topped well below the 20SMA. This is not good because it shows that fear is in abundance as we approach a probable retest.
SPY Weekly Chart: SPY managed to stay above the rising trend line support this week, but the weekly PMO implies that lower prices are coming.
Short-Term Market Indicators: They are dead neutral and can accommodate a move in any direction.
Intermediate-Term Market Indicators: All of these indicators are oversold based upon their range for most of the last three years. Let's wait to see what they look like after a retest. I have added the BPI to this chart because I want to watch it more closely for a while. For what it's worth, only 36% of S&P 500 stocks have their 20EMA above the 50EMA. That's quite a bit worse than the BPI at 43%.
CONCLUSION: I try to follow the rule that, if you ask question in the title, you should answer it in the article. So, are we in a bear market yet? My technical definition of a bear market is that the 50EMA is below the 200EMA, so, no, it isn't a bear market yet; however, the 20EMA is below the 50EMA, and that raises the caution flag. More specifically, it is not a good time to be opening new long positions, and, as usual, use stops (or other discipline) for closing longs.
As I said earlier, next week I think the market is set up for a retest of last week's lows. I would not be surprised it the retest failed.
Information posted to this board is not meant to suggest any specific action, but to point out the technical signs that can help our readers make their own specific decisions. Your Due Dilegence is a must! • DiscoverGold
Register for free to join our community of investors and share your ideas. You will also get access to streaming quotes, interactive charts, trades, portfolio, live options flow and more tools.


 News
News  Market Data
  Discover