


Sunday, September 23, 2018 4:37:11 PM
The chart below shows the Equal-Weight S&P 500 ETF (RSP) with 10-day RSI. I chose 10 days because 14-day RSI rarely exceeds 30/70 and 5-day RSI exceeds 30/70 too often. It is a fielders choice! First and foremost, notice the progression of higher highs from April to September. RSP also recorded fresh 52-week highs in August and September
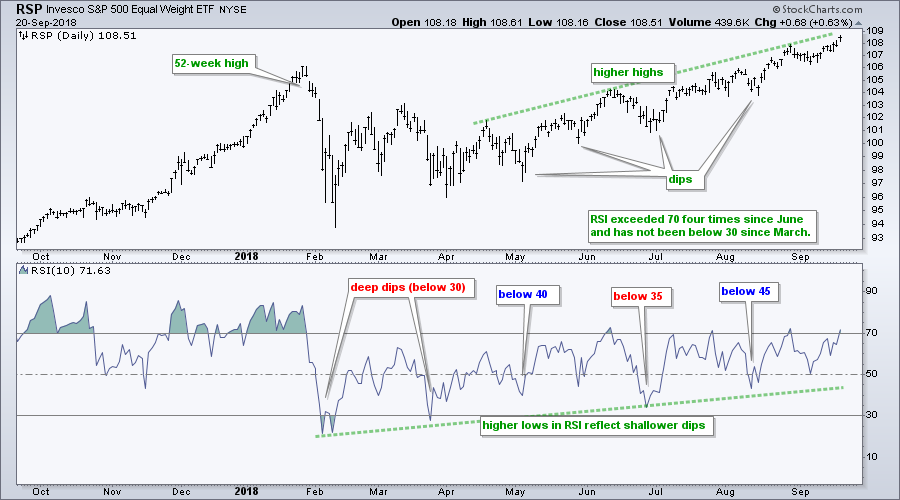
The indicator window shows RSI dipping well below 30 in early February with strong selling pressure. There was another dip below 30 in March, but this was not as deep. The dips since March have not exceeded 30 and RSI has not been below 40 since late June. This reflects limited selling pressure. Throw in four moves above 70 since June and you have a strong uptrend
North Bay Resources Commences Operations at Bishop Gold Mill, Inyo County, California; Engages Sabean Group Management Consulting • NBRI • Sep 25, 2024 9:15 AM
CEO David B. Dorwart Anticipates a Bright Future at Good Gaming Inc. Through His Most Recent Shareholder Update • GMER • Sep 25, 2024 8:30 AM
Cannabix Technologies and Omega Laboratories Inc. Advance Marijuana Breathalyzer Technology - Dr. Bruce Goldberger to Present at Society of Forensic Toxicologists Conference • BLOZF • Sep 24, 2024 8:50 AM
Integrated Ventures, Inc Announces Strategic Partnership For GLP-1 (Semaglutide) Procurement Through MedWell USA, LLC. • INTV • Sep 24, 2024 8:45 AM
Avant Technologies Accelerates Creation of AI-Powered Platform to Revolutionize Patient Care • AVAI • Sep 24, 2024 8:00 AM
VHAI - Vocodia Partners with Leading Political Super PACs to Revolutionize Fundraising Efforts • VHAI • Sep 19, 2024 11:48 AM

