XLE Gains PMO BUY Signal - Still Too Many Negatives in Intermediate Term By: Erin Swenlin | September 15, 2018
If you look at our DecisionPoint Sector Scoreboard below you'll see that the Energy is the only sector carrying an Intermediate-Term Trend Model Neutral signal. All other sectors have BUY signals in both the intermediate term and long term. While Energy did log a new Price Momentum Oscillator (PMO) BUY signal today, the negatives on the daily and weekly charts outweigh the positives.
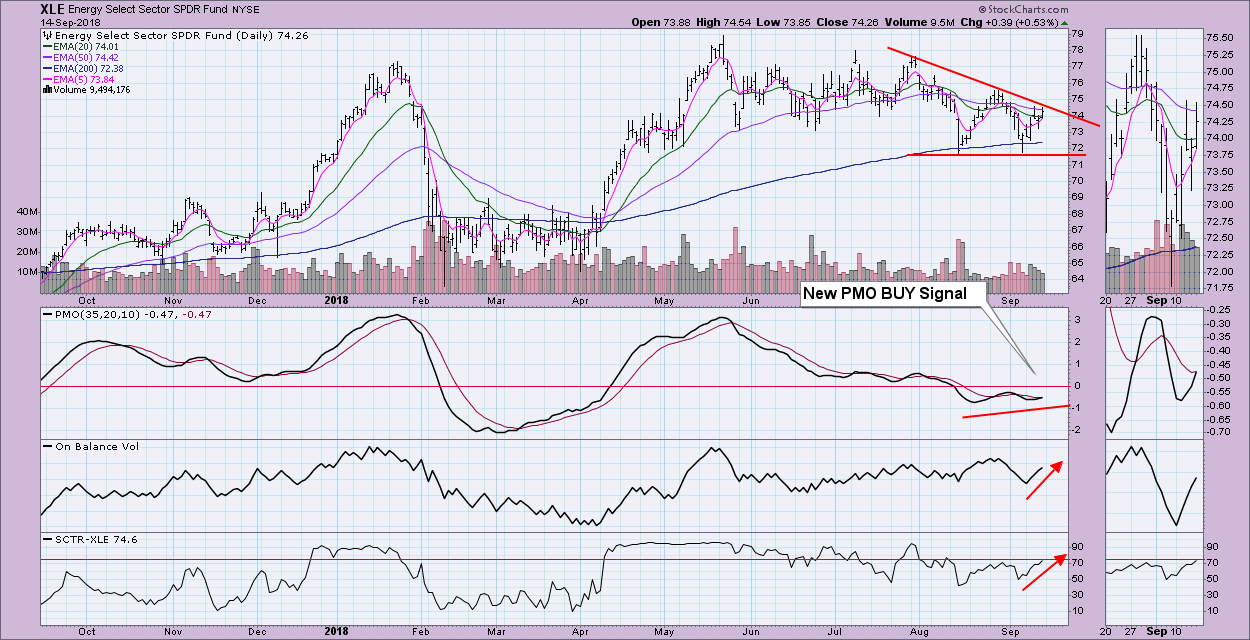
I've annotated the new PMO BUY signal on the daily chart below. Energy hasn't been performing well since peaking in May. It spent most of the summer months traveling sideways within a trading channel. We then saw it break down out of the channel last month. An attempt was made to rally to bring price back up to the top of the original trading channel, but it faded and tested the August low. Unfortunately, this has formed a descending triangle which is a bearish pattern. On the bright side, quite a bit of positive volume has poured into XLE which has the OBV rising strongly. Yet, volume hasn't pushed price to the heights or to a breakout I'd expect to see. The SCTR is improving as well. Rising bottoms on the PMO is in a positive divergence with price bottoms that form the support line of the triangle. The short-term picture is positive despite the bearish triangle pattern.
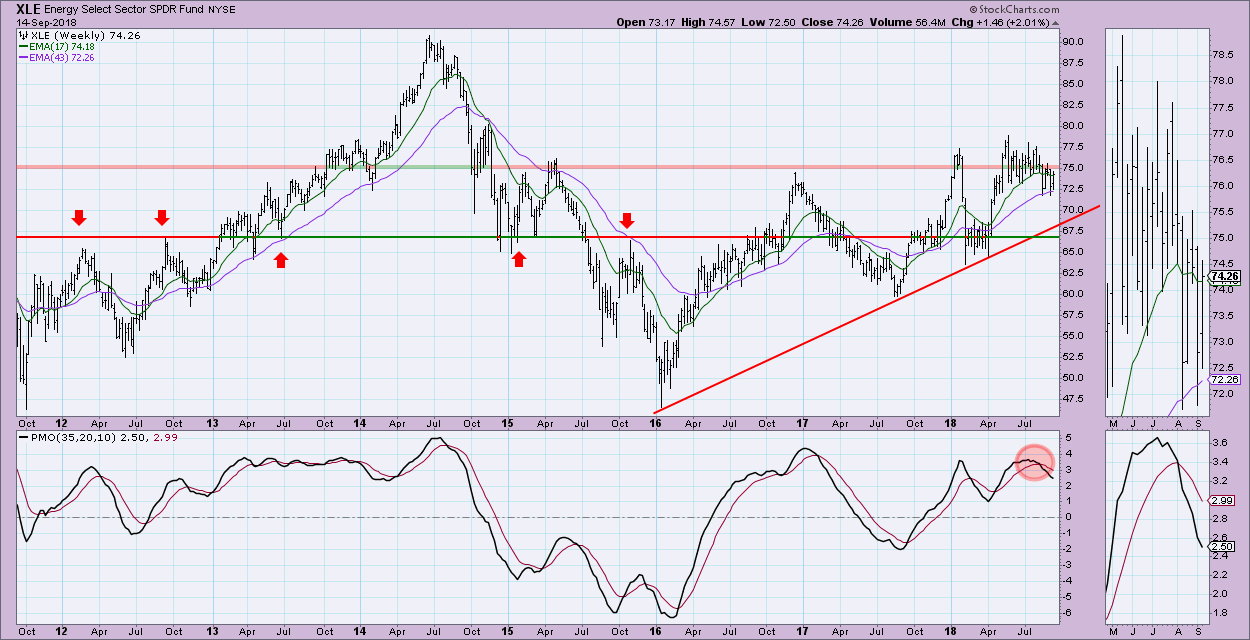
The intermediate-term picture on the weekly chart doesn't inspire confidence in this sector. Price failed to hold above support at the 2015/2016 tops and basically stalled out at $77.50. Since dropping back below the 2015/2016 tops, price hasn't been able to break back above. The 17-week EMA is falling and the PMO had an overbought SELL signal.
Conclusion: While we may've seen a new PMO BUY signal on the daily chart, the bearish descending triangle on the that chart as well as the very bearish weekly chart suggest that any rally we see in the short term won't hold for long. I'd look for a possible breakout above the daily chart's declining tops trendline, but a stall at overhead resistance at the August top around $76.00.
Technical Analysis is a windsock, not a crystal ball.
Information posted to this board is not meant to suggest any specific action, but to point out the technical signs that can help our readers make their own specific decisions. Your Due Dilegence is a must! • DiscoverGold
Register for free to join our community of investors and share your ideas. You will also get access to streaming quotes, interactive charts, trades, portfolio, live options flow and more tools.


 News
News  Market Data
  Discover