DP Alert: Short-Term Weakness Continues - Bonds Continue to Suffer But Holding Support By: Erin Swenlin | September 5, 2018
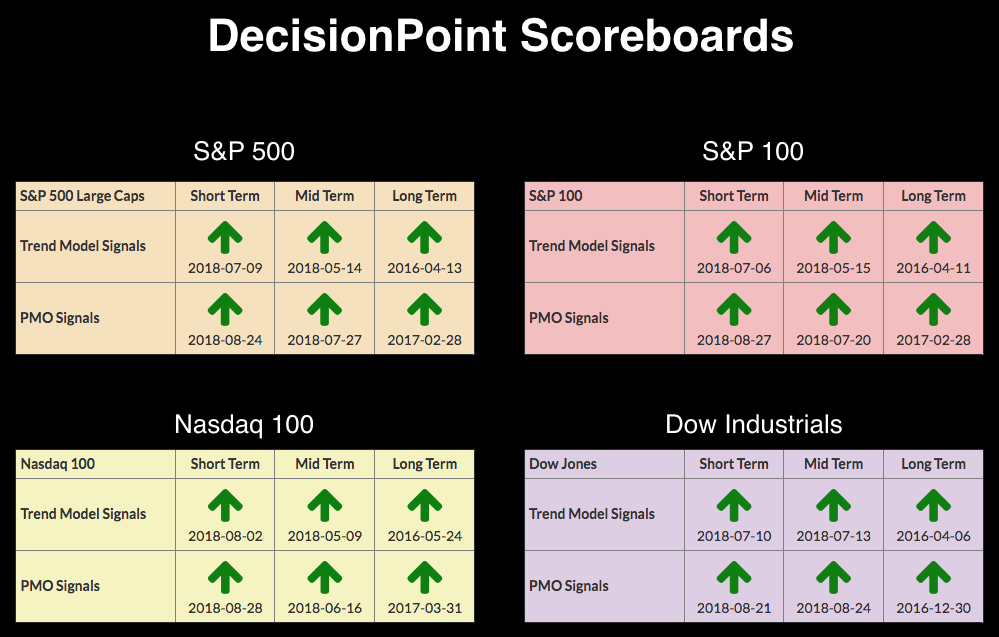
The DecisionPoint Scoreboards remain completely green, meaning all four indexes are on BUY signals in all three timeframes as far as price trend and condition. While it seems a condition we would want to celebrate, it suggests to me that the market is overextended. The consolidation and small decline on these indexes over the past week could cause a change or two to the Scoreboards, but if we see the market restart a rally after this week of little movement, signal changes would likely be avoided.
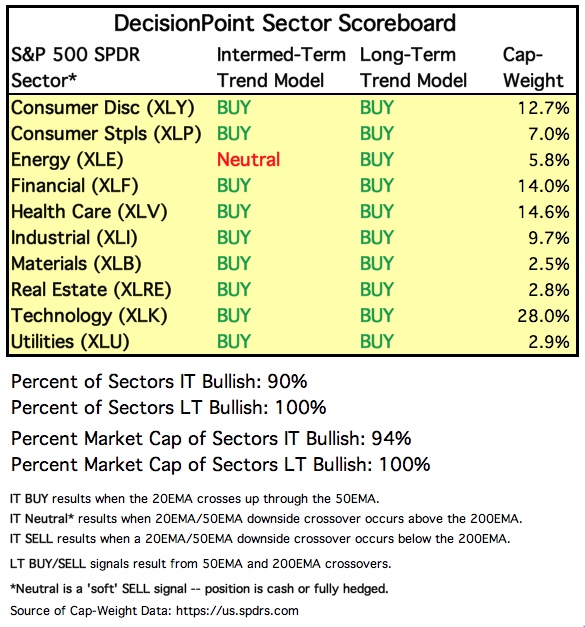
SECTORS
Each S&P 500 Index component stock is assigned to one, and only one, of 10 major sectors. This is a snapshot of the Intermediate-Term and Long-Term Trend Model signal status for those sectors.
STOCKS
IT Trend Model: BUY as of 5/11/2018
LT Trend Model: BUY as of 4/1/2016
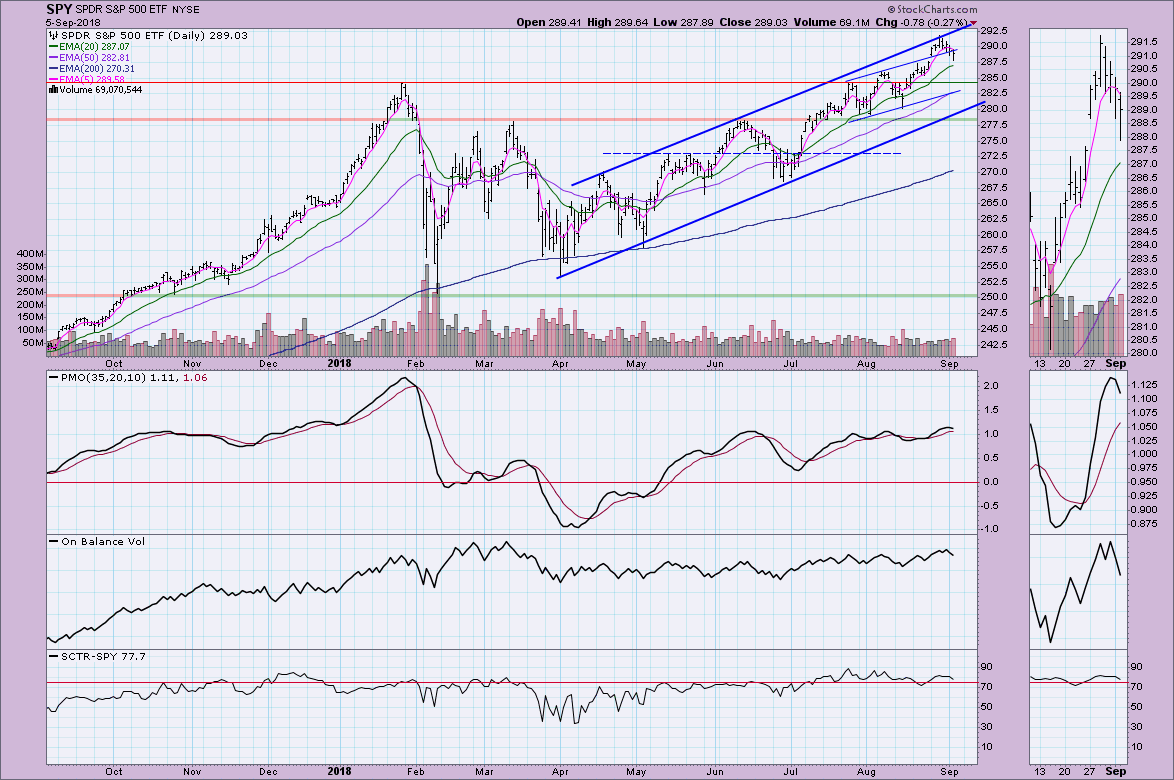
SPY Daily Chart: The rising price trend is intact. We saw some acceleration outside of the shorter-term rising trend channel which was quickly relieved. While we could be in for a test of the bottom of either of these channels, I suspect a pullback to the January top is about the worst we will see. The PMO top isn't good to see, but the OBV is still holding onto a rising bottoms trendline.
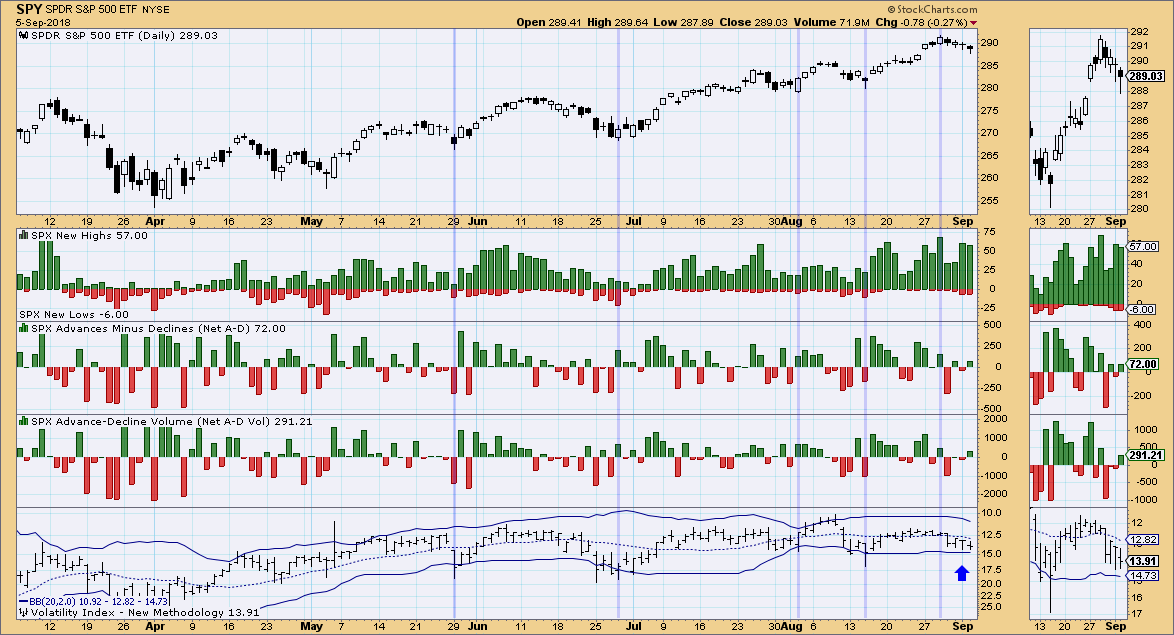
Climactic Market Indicators: Breadth isn't telling us much right now although New Highs are somewhat overbought. Most important on this chart to me is the VIX. I'm watching closely for a penetration of the lower Bollinger Band which would likely signal the end to this small decline.
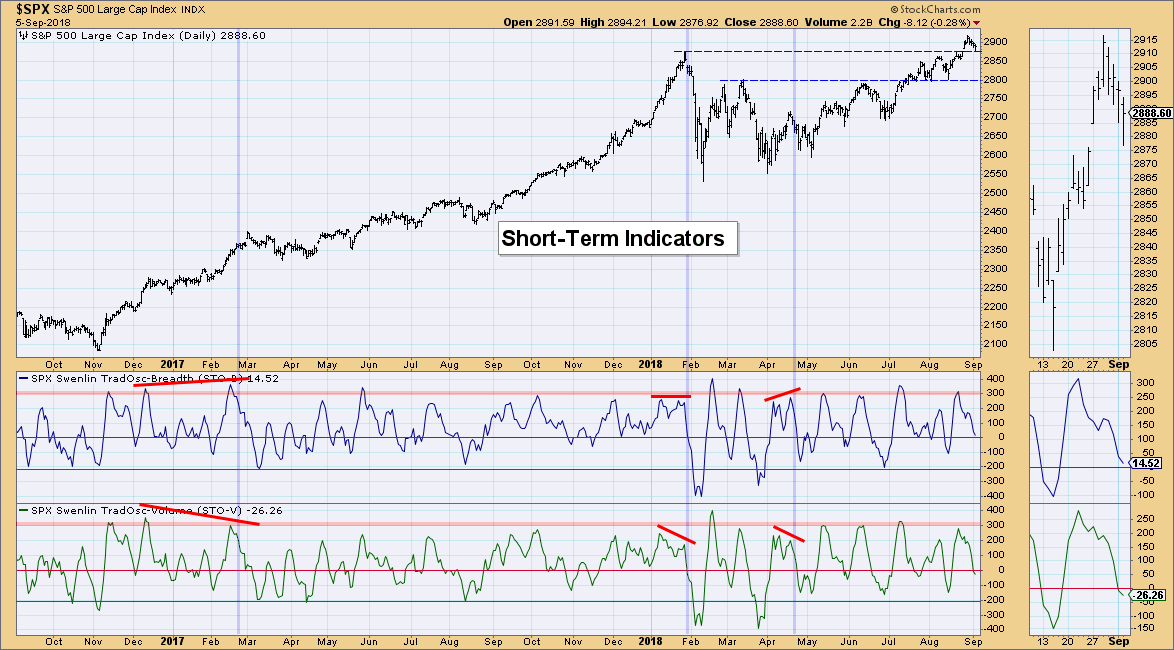
Short-Term Market Indicators: These indicators have now reached neutral territory. They decelerated somewhat today but the decline remains quite steep and suggests more downside or at a minimum some consolidation.
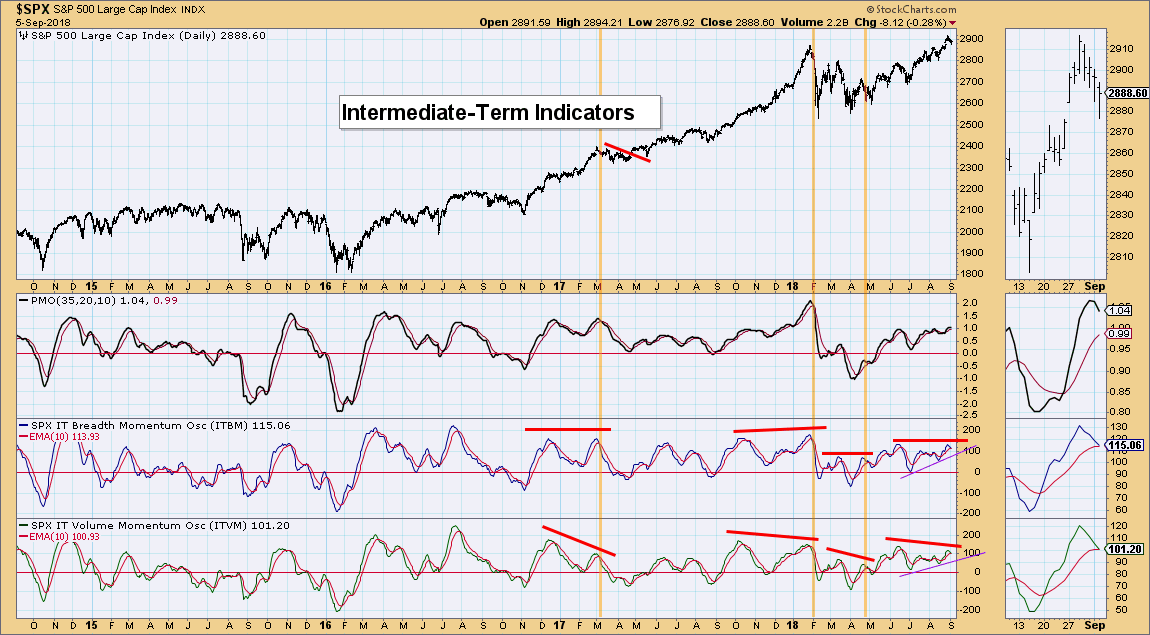
Intermediate-Term Market Indicators: I'm not liking this chart right now. The negative divergence between price tops and the ITVM tops is troubling. Typically when we see less support from the volume indicators, it suggests that volume is not supporting higher prices. I've felt that this timeframe was still positive, but this divergence could portend more downside over the longer term. I'll be watching not only for negative crossovers of the signal lines, but additionally whether the rising bottoms trendlines on both of these indicators is broken.
Conclusion: Indicators in all three timeframes suggest more downside for the SPX. While we are seeing all green Scoreboards, price was extended past the short-term rising trend channel which needed to be relieved. Be sure to read the DecisionPoint Weekly Wrap on Friday. Carl will give you the latest on these indicators and whether they have relieved overbought conditions enough to support a rally next week.
Information posted to this board is not meant to suggest any specific action, but to point out the technical signs that can help our readers make their own specific decisions. Your Due Dilegence is a must! • DiscoverGold
Register for free to join our community of investors and share your ideas. You will also get access to streaming quotes, interactive charts, trades, portfolio, live options flow and more tools.


 News
News  Market Data
  Discover