20-year Bond ETF (TLT) Looking More and More Bearish - PMO SELL Signal - IT and LT Head & Shoulders By: Erin Swenlin | September 4, 2018
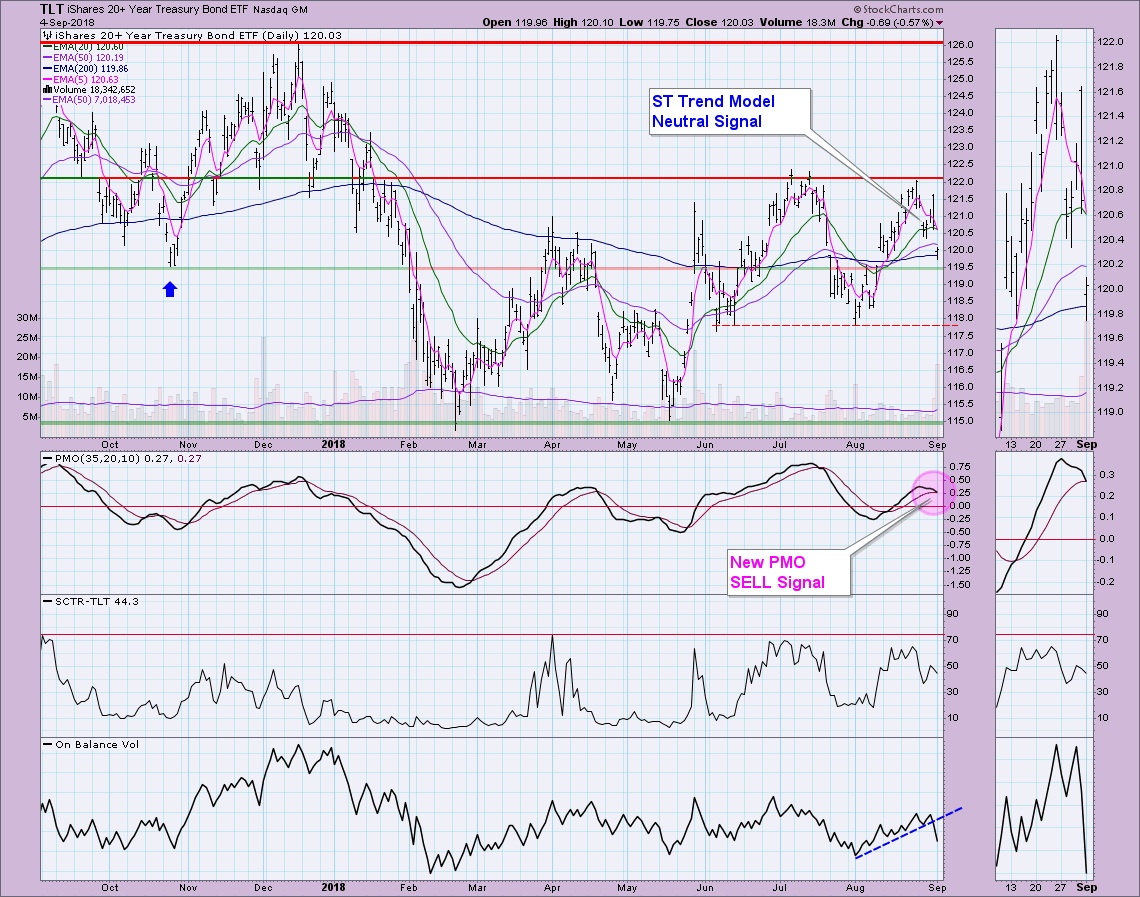
There were some new developments on the 20-year Bond ETF (TLT) that are tipping the scales bearish. We were already noticing some problems for Bonds in general, but volatile trading had made it difficult to decipher. Today there is no denying the negative bias as both a Short-Term Trend Model Neutral signal and a Short-Term Price Momentum Oscillator (PMO) SELL signal triggered.
The highly volatile trading range between $117.50 and $122.00 has made TLT an investment to avoid. We've seen multiple gaps and sadly many late Trend Model signals. The two bearish signals seem to be arriving at the right time, suggesting it is time for TLT to go test the bottom of its trading range.
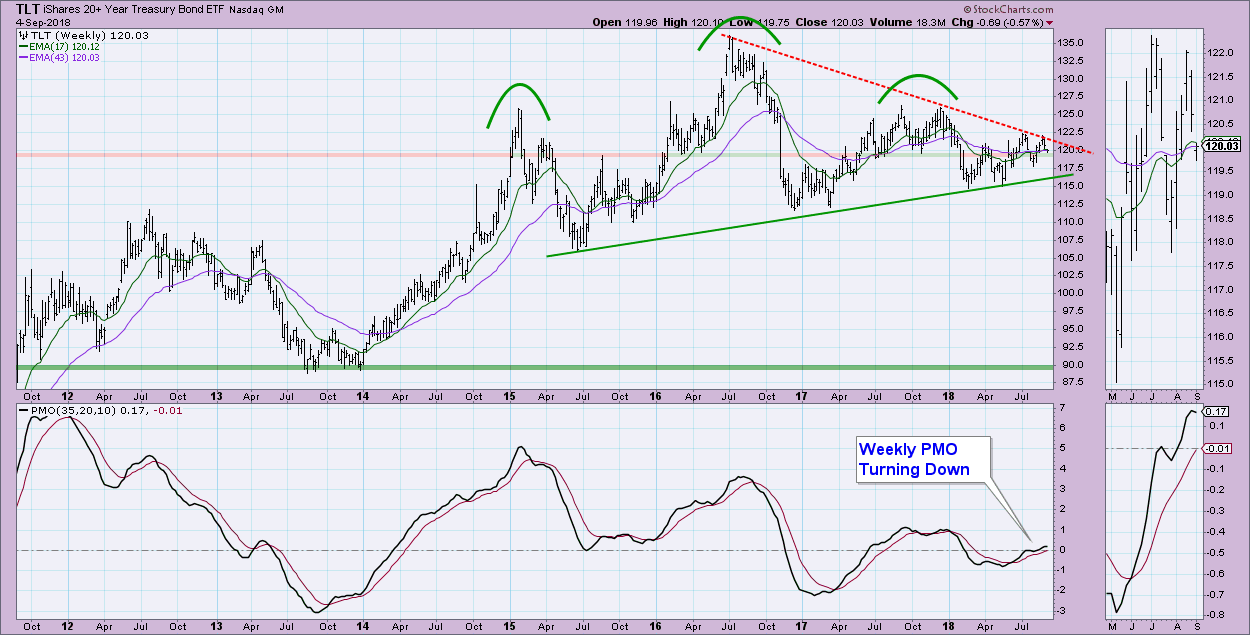
The intermediate-term picture on the weekly chart isn't favorable either. The weekly PMO is turning down as price has been stymied yet again at the declining tops trendline. The large head and shoulders pattern hasn't quite executed. Price does still have an opportunity to hold support along the October 2017 low and rising bottoms trendline around $117.50. The 17-week EMA is just about ready to drop below the 43-week EMA which suggests to me more downside.
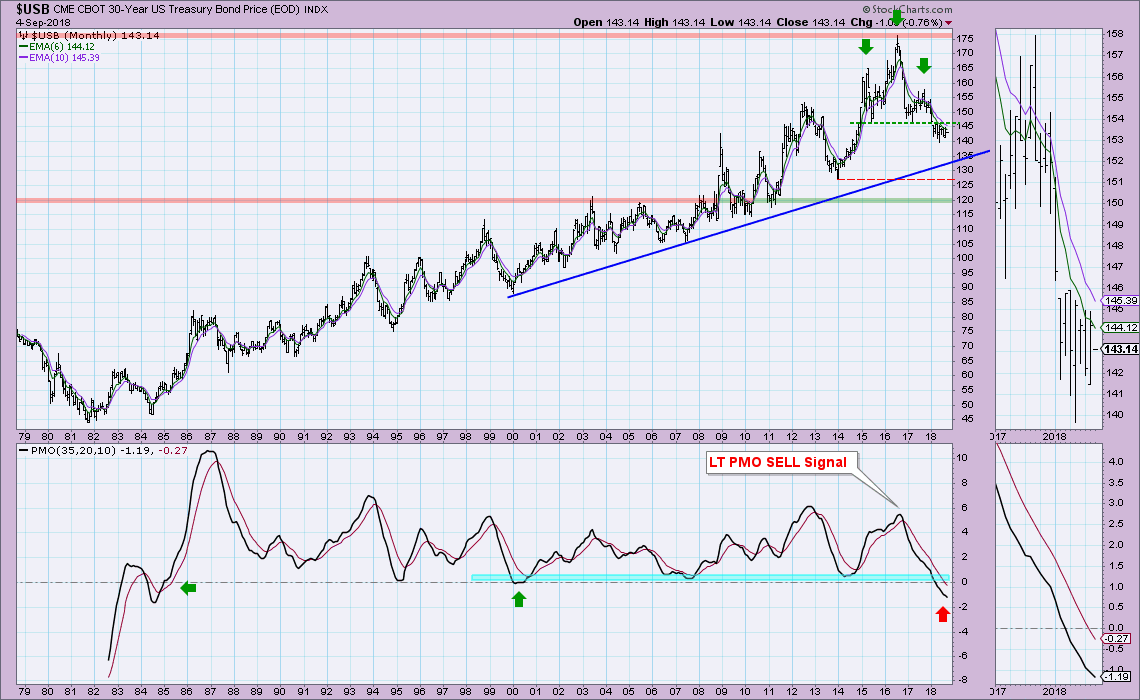
The 30-Year Bond monthly chart ($USB) shows a similar head and shoulders pattern, only in the case of $USB, the pattern has executed. If we measure the pattern and look for a drop that same height, it magically gives us a minimum downside target that matches up with the tops from 2003 to 2008. Note also that the PMO has reached negative territory and a reading that hasn't been seen since 2004.
Conclusion: I would look for a breakdown or even a possible correction on Bonds given the weak picture in all three time frames.
Technical Analysis is a windsock, not a crystal ball.
Information posted to this board is not meant to suggest any specific action, but to point out the technical signs that can help our readers make their own specific decisions. Your Due Dilegence is a must! • DiscoverGold
Register for free to join our community of investors and share your ideas. You will also get access to streaming quotes, interactive charts, trades, portfolio, live options flow and more tools.


 News
News  Market Data
  Discover