


| Followers | 689 |
| Posts | 143817 |
| Boards Moderated | 35 |
| Alias Born | 03/10/2004 |
Tuesday, September 04, 2018 8:50:50 AM
When a September Pullback Could Happen
By: Schaeffer's Investment Research | September 4, 2018
The Fed is expected to raise interest rates later this month
The four-week AAII bull change just rose at its fastest pace since the start of the year
Despite a constant barrage of negative headlines regarding U.S. trade topics, the flattening yield curve, negative seasonality, and the Turkey crisis during the past month, the market seems to have grown numb to the macro news cycle. Instead, market participants have focused on the positive earnings season and upbeat economic data, like the 4.2% gross domestic product (GDP) growth we saw in the second quarter, which allowed the S&P 500 Index (SPX - 2,901.52) to finish the month on a positive note.
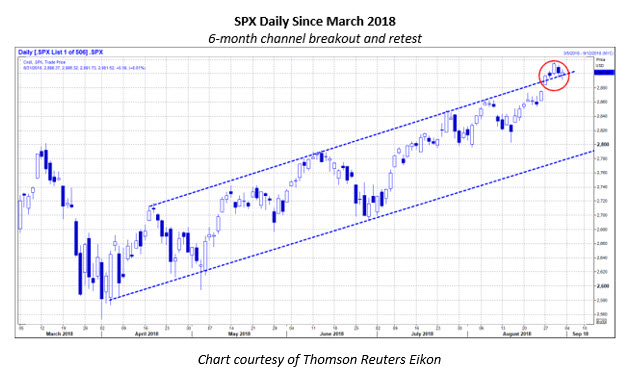
Moreover, the SPX and the SPDR S&P 500 ETF Trust (SPY - 290.31) continued to rally into "blue-sky" territory, breaking out of a six-month-long uptrend channel. The SPX tested the round-number support level of 2,900 during a late-week pullback, which happened to coincide with a put-heavy SPY strike range from the 287-strike to the 290-strike -- all of which expired worthless. Pullbacks like this are rather healthy and quite typical during a market advance.
In addition, we have seen consistent sector rotation during the past month, with a particular left-for-dead sector seeing a substantial sentiment change among market participants. The specific sector that stood out to me was telecommunications, with the SPDR S&P Telecom ETF (XTL - 77.03) finishing the month up by 7.95%. While technology may have lagged during most of the summer, as some pundits have pointed out as a concern, the Technology Select Sector SPDR Fund (XLK - 75.60) was the second-best performer, finishing up 6.60% for the month of August.
Simply put, highly rotative markets aren't typically indicative of an immediate looming correction, but rather, it's typically a bullish sign of a sustainable trend in the short term. Furthermore, markets also rarely rotate into risk-on assets like biotech, software services, and medical technology before market corrections, and typically gravitate toward defensive sectors like utilities and consumer staples beforehand.
"Without slumping economic data points, financial strategists and pundits have relied on seasonality as a potential catalyst for a sell-off. Indeed, August can often be the start of seasonal corrections for the broader markets. That's a fact when you look at the data over the last two decades, but that doesn't mean we're necessarily due for an imminent correction as some have suggested, or that we'll finish negative for the month."
-- Monday Morning Outlook, August 13, 2018
As I discussed last month, we were seeing many pundits talk about seasonality in August, and how it could derail the markets. We are once again starting to see seasonality in the headlines of the financial media stating that September is historically the worst month for stocks.
Indeed, September is by far the worst month for the S&P 500 since 1928, with a net average return of -1.00%, and it's also one of the most volatile months on record. But as I previously discussed, seasonality data could easily be used to provide bullish headlines. What is not being said is that over the past 15 years, September has been net positive 66.6% of the time, with an average return of +0.81% on a monthly basis. Or, if you would rather look at the last decade, it has been net positive 60% of the time, with an average return of +0.76% on a monthly basis, according to Reuters data.
"If past is prologue, the next month could be a good one for equities, as fed funds futures are placing only a 2.5% probability on a rate hike on Wednesday, according to the CME Group website. The tables below break down SPY price action in the calendar month following a decision by the FOMC to either hike the fed funds rate or hold it steady since the tightening cycle began in December 2015. Clearly, investors have been in more of a buying mode after a Fed decision to hold rates steady."
-- Monday Morning Outlook, July 30, 2018
Another continuing theme that we've touched on is the immediate reactions in the S&P 500 after a Federal Open Market Committee (FOMC) decision to hold or hike interest rates. This short-term indicator once again proved to be correct in August, and with the Federal Reserve not meeting until the final trading day of September, we could likely see the market continue its bullish trend until then.
However, the Federal Reserve is expected to hike rates at its September meeting, with Reuters survey data stating a 94.6% probability of a rate hike. After a post-Fed rate hike is when we believe there's heightened chance that a pullback could happen, as buyers seem to favor the equity markets when the central bank decides to hold rates steady.
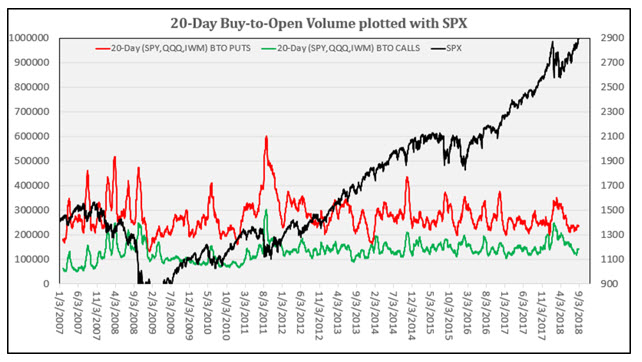
Elsewhere, sentiment data is finally leaning on the optimistic side, after remaining pessimistic-to-neutral throughout August. The 10-day moving average of the equity-only buy-to-open put/call volume ratio continues to fall -- at 0.531, as of Aug. 29 -- which has fueled the rally as participants have turned more bullish. Meanwhile, cumulative 20-day buy-to-open call volume on major equity-based exchange-traded funds (ETFs) rose by 11%, while the put volume only rose 3% -- which is something we'll keep an eye on throughout September to see if a trend develops.
Finally, in the most recent weekly American Association of Individual Investors (AAII) survey, bullish sentiment increased by 5 percentage points, and the four-week bull change of 49.5% is the most since the beginning of the year, where we saw a four-week gain of 62.1% a few weeks prior to the January and February sell-off. Continued increases in optimism heading into the Fed decision could be a warning sign that we may once again see a post-Fed rate hike sell-off.
As experienced market participants know, nothing is assured, and price action can change rather quickly in the third quarter, as seasonality suggests. But, with the S&P 500, Nasdaq Composite (IXIC - 8,109.54), and the Russell 2000 Index (RUT - 1,740.75) all breaking out to new all-time highs, we see broad-market participation and market breadth continuing to expand, which bodes well for the first few weeks of the month as speculators continue to ratchet up their optimism to extremes before heading into the FOMC decision on Wednesday, Sept. 26.
https://www.schaeffersresearch.com/content/analysis/2018/09/04/when-a-september-pullback-could-happen
• DiscoverGold
By: Schaeffer's Investment Research | September 4, 2018
The Fed is expected to raise interest rates later this month
The four-week AAII bull change just rose at its fastest pace since the start of the year
Despite a constant barrage of negative headlines regarding U.S. trade topics, the flattening yield curve, negative seasonality, and the Turkey crisis during the past month, the market seems to have grown numb to the macro news cycle. Instead, market participants have focused on the positive earnings season and upbeat economic data, like the 4.2% gross domestic product (GDP) growth we saw in the second quarter, which allowed the S&P 500 Index (SPX - 2,901.52) to finish the month on a positive note.
Moreover, the SPX and the SPDR S&P 500 ETF Trust (SPY - 290.31) continued to rally into "blue-sky" territory, breaking out of a six-month-long uptrend channel. The SPX tested the round-number support level of 2,900 during a late-week pullback, which happened to coincide with a put-heavy SPY strike range from the 287-strike to the 290-strike -- all of which expired worthless. Pullbacks like this are rather healthy and quite typical during a market advance.

In addition, we have seen consistent sector rotation during the past month, with a particular left-for-dead sector seeing a substantial sentiment change among market participants. The specific sector that stood out to me was telecommunications, with the SPDR S&P Telecom ETF (XTL - 77.03) finishing the month up by 7.95%. While technology may have lagged during most of the summer, as some pundits have pointed out as a concern, the Technology Select Sector SPDR Fund (XLK - 75.60) was the second-best performer, finishing up 6.60% for the month of August.
Simply put, highly rotative markets aren't typically indicative of an immediate looming correction, but rather, it's typically a bullish sign of a sustainable trend in the short term. Furthermore, markets also rarely rotate into risk-on assets like biotech, software services, and medical technology before market corrections, and typically gravitate toward defensive sectors like utilities and consumer staples beforehand.
"Without slumping economic data points, financial strategists and pundits have relied on seasonality as a potential catalyst for a sell-off. Indeed, August can often be the start of seasonal corrections for the broader markets. That's a fact when you look at the data over the last two decades, but that doesn't mean we're necessarily due for an imminent correction as some have suggested, or that we'll finish negative for the month."
-- Monday Morning Outlook, August 13, 2018
As I discussed last month, we were seeing many pundits talk about seasonality in August, and how it could derail the markets. We are once again starting to see seasonality in the headlines of the financial media stating that September is historically the worst month for stocks.
Indeed, September is by far the worst month for the S&P 500 since 1928, with a net average return of -1.00%, and it's also one of the most volatile months on record. But as I previously discussed, seasonality data could easily be used to provide bullish headlines. What is not being said is that over the past 15 years, September has been net positive 66.6% of the time, with an average return of +0.81% on a monthly basis. Or, if you would rather look at the last decade, it has been net positive 60% of the time, with an average return of +0.76% on a monthly basis, according to Reuters data.
"If past is prologue, the next month could be a good one for equities, as fed funds futures are placing only a 2.5% probability on a rate hike on Wednesday, according to the CME Group website. The tables below break down SPY price action in the calendar month following a decision by the FOMC to either hike the fed funds rate or hold it steady since the tightening cycle began in December 2015. Clearly, investors have been in more of a buying mode after a Fed decision to hold rates steady."
-- Monday Morning Outlook, July 30, 2018
Another continuing theme that we've touched on is the immediate reactions in the S&P 500 after a Federal Open Market Committee (FOMC) decision to hold or hike interest rates. This short-term indicator once again proved to be correct in August, and with the Federal Reserve not meeting until the final trading day of September, we could likely see the market continue its bullish trend until then.
However, the Federal Reserve is expected to hike rates at its September meeting, with Reuters survey data stating a 94.6% probability of a rate hike. After a post-Fed rate hike is when we believe there's heightened chance that a pullback could happen, as buyers seem to favor the equity markets when the central bank decides to hold rates steady.
Elsewhere, sentiment data is finally leaning on the optimistic side, after remaining pessimistic-to-neutral throughout August. The 10-day moving average of the equity-only buy-to-open put/call volume ratio continues to fall -- at 0.531, as of Aug. 29 -- which has fueled the rally as participants have turned more bullish. Meanwhile, cumulative 20-day buy-to-open call volume on major equity-based exchange-traded funds (ETFs) rose by 11%, while the put volume only rose 3% -- which is something we'll keep an eye on throughout September to see if a trend develops.

Finally, in the most recent weekly American Association of Individual Investors (AAII) survey, bullish sentiment increased by 5 percentage points, and the four-week bull change of 49.5% is the most since the beginning of the year, where we saw a four-week gain of 62.1% a few weeks prior to the January and February sell-off. Continued increases in optimism heading into the Fed decision could be a warning sign that we may once again see a post-Fed rate hike sell-off.
As experienced market participants know, nothing is assured, and price action can change rather quickly in the third quarter, as seasonality suggests. But, with the S&P 500, Nasdaq Composite (IXIC - 8,109.54), and the Russell 2000 Index (RUT - 1,740.75) all breaking out to new all-time highs, we see broad-market participation and market breadth continuing to expand, which bodes well for the first few weeks of the month as speculators continue to ratchet up their optimism to extremes before heading into the FOMC decision on Wednesday, Sept. 26.
https://www.schaeffersresearch.com/content/analysis/2018/09/04/when-a-september-pullback-could-happen
• DiscoverGold
Information posted to this board is not meant to suggest any specific action, but to point out the technical signs that can help our readers make their own specific decisions. Your Due Dilegence is a must!
• DiscoverGold
Join the InvestorsHub Community
Register for free to join our community of investors and share your ideas. You will also get access to streaming quotes, interactive charts, trades, portfolio, live options flow and more tools.

