2Q Corporate Results: All-Time High Sales, Profits and Margins By: Urban Carmel | August 14, 2018
Summary: Overall, corporate results in the second quarter were excellent. S&P sales grew 11%, earnings rose 27% and profit margins expanded to a new all-time high of 11.4%.
Fundamentals are driving the stock market higher, not valuations: earnings during the past 1 year and 2 years have risen faster than the S&P index itself. The strong growth in company profits is not due to the net reduction in shares through, for example, corporate buybacks.
The outlook in 2018 looks solid: the consensus expects earnings to grow 21% this year. Rising energy prices and the tax reform law are tailwinds.
Expectations for 10% earnings growth in 2019 looks too optimistic and will likely be revised downward; the substantial jump in margins this year is unlikely to be sustained, especially with labor and interest expenses rising.
Valuations are back to their 25-year average. They are not cheap, but the excess from 2017 and early 2018 has been worked off. If investors once again become ebullient, there is room for valuations to expand.
* * *
90% of the companies in the S&P 500 have released their second quarter (2Q18) financial reports. The headline numbers are very good. Here are the details:
Sales
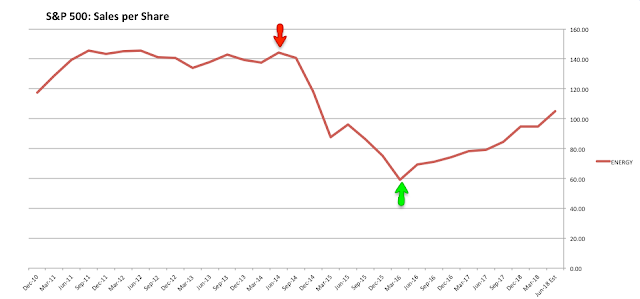
Quarterly sales reached a new all-time high, growing 11% over the past year, the best sales growth in 7 years (since 2011). On a trailing 12-month basis (TTM), sales are 9% higher yoy (all financial data in this post is from S&P). Enlarge any image by clicking on it.
The arrows in the chart above indicate the period from 2Q14 to 1Q16 when oil prices fell 70%. The negative affect on overall S&P sales (above) and the energy sector alone (below) is easy to spot.
In the past year, the six sectors with the highest weighting in the S&P have grown an average of 10.2% (box in middle column) and since the peak in oil in 2Q14, their sales have grown an average of 27.8%. In contrast, energy sector sales have declined 25% (far right column).
Excluding the volatile energy sector, sales for the remainder of the S&P have continued to trend higher at about the same rate over the past 7 years (blue line; from Yardeni).
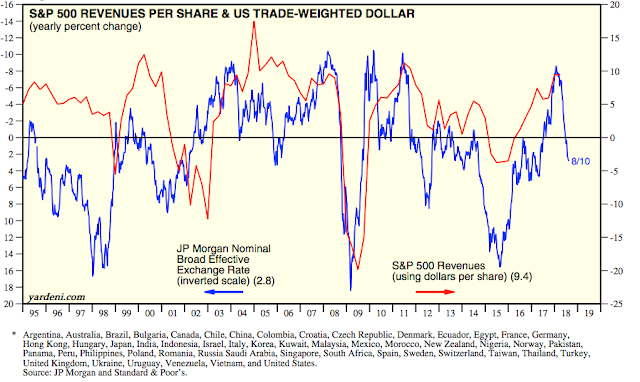
The dollar has been a minor tailwind for sales: in the past year (thru 2Q18), the dollar depreciated by 2%; this accounts for about 1 percentage point of the growth in corporate sales. For the current quarter (3Q18), the dollar is pacing a 4% yoy appreciation, a minor headwind.
How does the dollar impact sales growth? Companies in the S&P derive about half of their sales from outside of the US. When the dollar rises in value, the value of sales earned abroad (in foreign currency) falls, and vice versa. If foreign sales grow 5% but the dollar gains 5% against other currencies, then sales growth will be zero in dollar terms. The chart below compares changes in the dollar (blue line; inverted) with growth in S&P sales (red line): a higher dollar corresponds with lower sales (from Yardeni).
Earnings and Margins
Quarterly EPS (operating-basis) is also at a new all-time high, growing 27% over the past year on a quarterly-basis and 21% on a trailing 12-month basis (TTM).
Click on "In reply to", for Authors past commentaries
Information posted to this board is not meant to suggest any specific action, but to point out the technical signs that can help our readers make their own specific decisions. Your Due Dilegence is a must! • DiscoverGold
Register for free to join our community of investors and share your ideas. You will also get access to streaming quotes, interactive charts, trades, portfolio, live options flow and more tools.


 News
News  Market Data
  Discover