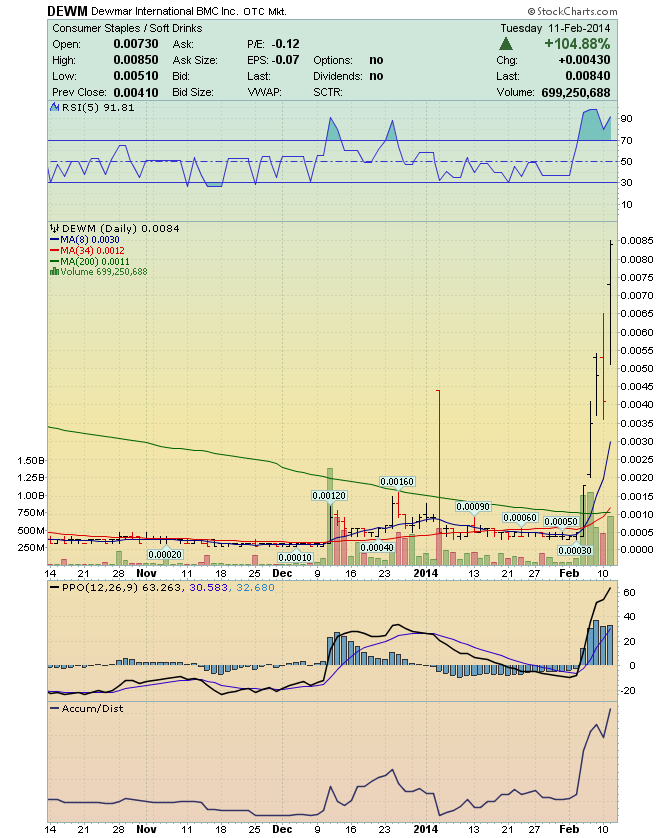
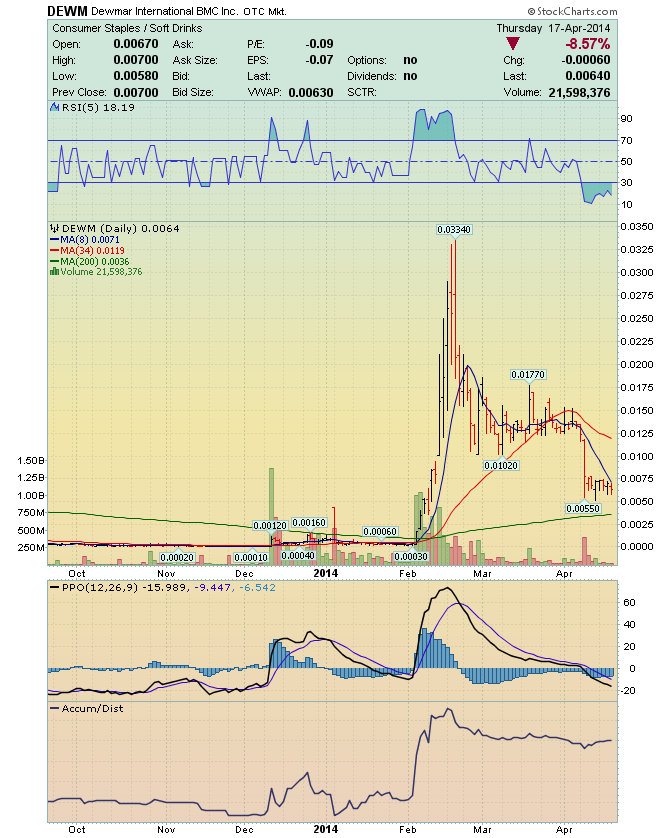
BGFT - Can Reach $0.03 like DEWM BGFT - Targets 0.0075 / $0.015 / $0.03 ________________________________________________________________ DEWM - Alerted at 0.0001 - Climbs to $0.0334 https://investorshub.advfn.com/boards/read_msg.aspx?message_id=142330981 DEWM - "I can lead a horse to water, but I can't make him drink" ! https://investorshub.advfn.com/boards/read_msg.aspx?message_id=141157589 _________________________________________________________________ DEWM Security Details Share Structure Market Value1........$26,396,659 a/o Jun 26, 2017 Authorized Shares..4,500,000,000 a/o Dec 26, 2013 Outstanding Shares 2,426,163,513 a/o Jun 15, 2017 Float.............. 2,256,863,590 a/o Dec 31, 2016 Par Value 0.001 _________________________________________________________________ Pink Current Information BGFT Security Details Share Structure Market Value1................$1,498,683 a/o Aug 10, 2018 Authorized Shares....6,500,000,000 a/o Aug 01, 2018 Outstanding Shares...2,046,353,219 a/o Aug 01, 2018 Restricted.....................468,976,111 a/o Aug 01, 2018 Unrestricted...............1,404,377,108 a/o Aug 01, 2018 Float.......................... 1,250,000,000 a/o Aug 08, 2018 Par Value 0.001 https://quotes.wsj.com/BGFT Authorized Shares, has no bearing on the price . The "Shares Authorized", is not used in any fundamental of financial calculation, to determine company value . ________________________________________________________________ https://investorshub.advfn.com/uimage/uploads/2016/12/18/cezezDEWM_Chart_0.0001.png https://www.stockscores.com/chart.asp?TickerSymbol=BGFT&TimeRange=150&Interval=d&Volume=1&ChartType=OHLC&Stockscores=1&ChartWidth=1100&ChartHeight=480&LogScale=None&Band=None&avgType1=SMA&movAvg1=5&avgType2=SMA&movAvg2=34&Indicator1=RSI&Indicator2=PPO&Indicator3=AccDist&Indicator4=MFI&endDate=&CompareWith=&entryPrice=&stopLossPrice= https://investorshub.advfn.com/uimage/uploads/2016/12/18/crcbnDEWM_Chart_2_from_0.0001_to_0.0334.png https://www.stockscores.com/chart.asp?TickerSymbol=BGFT&TimeRange=240&Interval=d&Volume=1&ChartType=OHLC&Stockscores=1&ChartWidth=1100&ChartHeight=480&LogScale=None&Band=None&avgType1=SMA&movAvg1=5&avgType2=SMA&movAvg2=34&Indicator1=RSI&Indicator2=PPO&Indicator3=AccDist&Indicator4=MFI&endDate=&CompareWith=&entryPrice=&stopLossPrice= https://investorshub.advfn.com/uimage/uploads/2016/12/18/crcbnDEWM_Chart_2_from_0.0001_to_0.0334.png https://www.stockscores.com/chart.asp?TickerSymbol=BGFT&TimeRange=300&Interval=d&Volume=1&ChartType=OHLC&Stockscores=1&ChartWidth=1100&ChartHeight=480&LogScale=None&Band=None&avgType1=SMA&movAvg1=5&avgType2=SMA&movAvg2=34&Indicator1=RSI&Indicator2=PPO&Indicator3=AccDist&Indicator4=MFI&endDate=&CompareWith=&entryPrice=&stopLossPrice= https://investorshub.advfn.com/uimage/uploads/2016/12/18/crcbnDEWM_Chart_2_from_0.0001_to_0.0334.png https://www.stockscores.com/chart.asp?TickerSymbol=BGFT&TimeRange=330&Interval=d&Volume=1&ChartType=OHLC&Stockscores=1&ChartWidth=1100&ChartHeight=480&LogScale=None&Band=None&avgType1=SMA&movAvg1=5&avgType2=SMA&movAvg2=34&Indicator1=RSI&Indicator2=PPO&Indicator3=AccDist&Indicator4=MFI&endDate=&CompareWith=&entryPrice=&stopLossPrice= https://investorshub.advfn.com/uimage/uploads/2016/12/18/crcbnDEWM_Chart_2_from_0.0001_to_0.0334.png https://www.stockscores.com/chart.asp?TickerSymbol=BGFT&TimeRange=365&Interval=d&Volume=1&ChartType=OHLC&Stockscores=1&ChartWidth=1100&ChartHeight=480&LogScale=None&Band=None&avgType1=SMA&movAvg1=5&avgType2=SMA&movAvg2=34&Indicator1=RSI&Indicator2=PPO&Indicator3=AccDist&Indicator4=MFI&endDate=&CompareWith=&entryPrice=&stopLossPrice=
 News
News  Market Data
  Discover