


| Followers | 689 |
| Posts | 143817 |
| Boards Moderated | 35 |
| Alias Born | 03/10/2004 |
Friday, July 27, 2018 9:57:49 AM
The Top 5 Stocks Are Big. And They're Outperforming. This Is Normal
By: Urban Carmel | July 26, 2018
Summary: The 5 largest stocks comprise about 16% of the S&P 500. That's normal. In fact, the importance of the top 5 stocks was far greater in the 1970s than anytime in the past 5 years.
It's true that today's top 5 stocks - known by the acronym FAAMG - have largely outperformed most other stocks. That's how they became today's top 5. Over time, stock indices have typically been driven higher by a small number of stocks. And over time, those leaders have continually changed. This is the story of the stock market. Only one of today's top 5 was also in the top 5 in 2013. At the height of the tech bubble in 2000, the top 5 were companies like GE, Exxon, Pfizer, Citigroup and Cisco.
Right now, most stocks are doing fine: an index in which non-FAAMG stocks have a 99% weighting closed at the second highest level in its history today. It's on pace for a 10% gain in 2018.
* * *
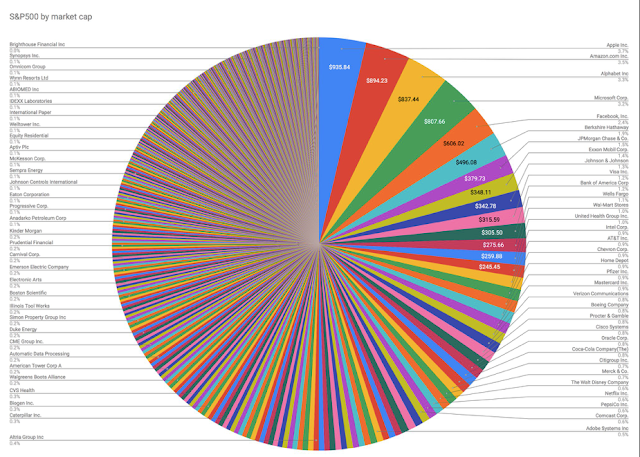
The 5 biggest stocks in the S&P 500 - known by the acronym FAAMG - are equal to the smallest 282 stocks. Enlarge any chart by clicking on it (from Michael Batnick).

Note that this does not mean that the these 5 stocks are equal to half the index. Instead, they equal about 16% of the S&P (from Jack Gavigan).
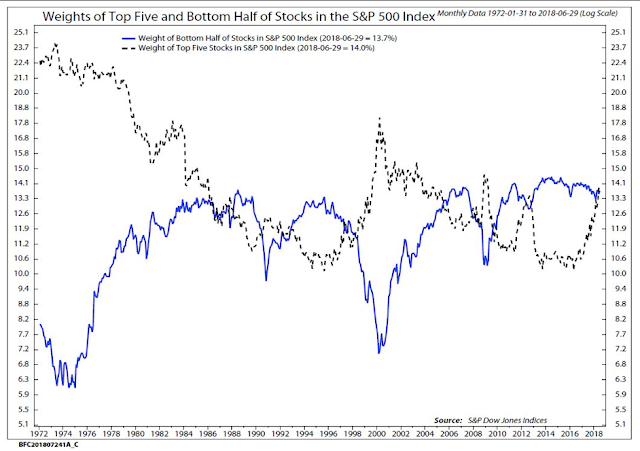
Is this concentration an extreme? The top 5 stocks had a higher weighting in March 2000 and about the same weighting in June 2007. These were bull market highs, so this seems worrisome. But the weighting was was also higher in March 2009, a bear market low (from @EconomPic).

In fact, over time, the top 5 stocks (gray line) usually have a higher weighting than the smallest half of the index (blue line). The importance of the top 5 stocks was far greater in the 1970s than anytime in the past 5 years (from NDR Research).
Now, it's true that the FAAMG stocks have outperformed the rest of the index, and that their weighting has therefore doubled in the past 5 years (from Michael Batnick).

But that is not the same as saying the top 5 stocks have doubled their weighting. As NDR's research shows, the top 5 have increased their weighting by about 1/3. What accounts for the difference? Survivorship bias. Today's top 5 have, by definition, largely outperformed most stocks. That's how they became today's top 5.
Only 1 of today's top 5 was in the top 5 in 2013: Apple. The other top 5 companies in the US were Exxon, Berkshire, Walmart and GE. Google, Amazon and Facebook were not even the Global top 10 in 2013. And previous heavy weights, like Wells Fargo, IBM, Walmart and Chevron have completely fallen off the list. Today's behemoths are obvious only in hindsight (from @tableaupublic).

This is the story of the stock market. Over time, the leaders change. In 1980, 7 of the top 10 in the US were in the oil and gas industry. At the height of the tech bubble in 2000, the top 5 were companies like GE, Exxon, Pfizer, Citigroup and Cisco (from Ben Carlson).

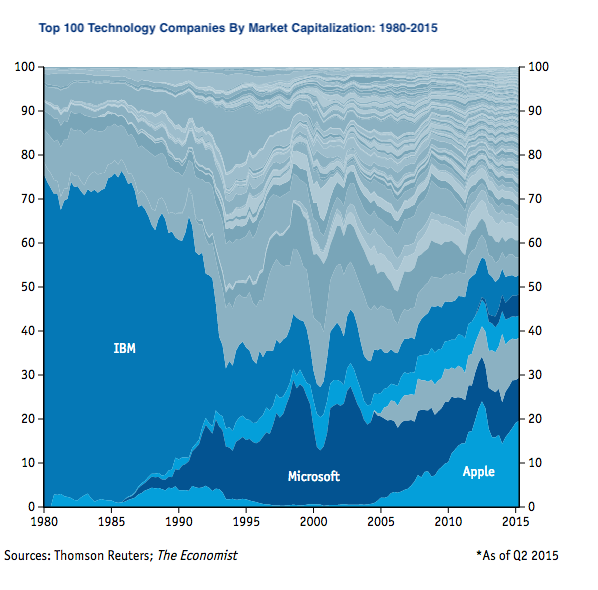
One constant in the stock market is the worry about concentration. It's hard to believe now but the dominance of IBM used to be a concern. Alone, it was more than 6% of the S&P in 1985 and it dominated the computer and software business in ways that seemed insurmountable to competitors and investors at the time. But new leaders emerged, the previous behemoth was put aside and the stock market was largely unaffected (from the Economist).
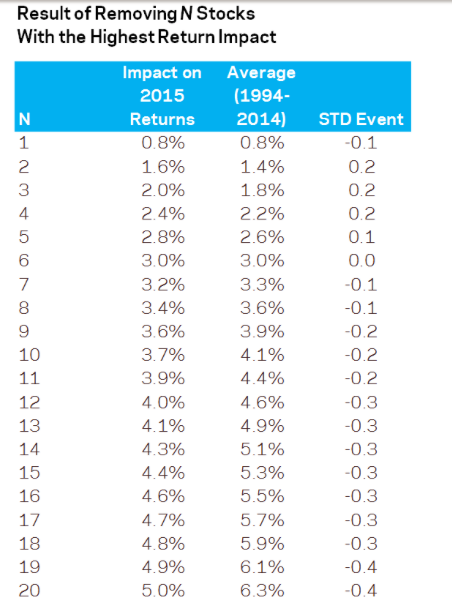
While it might seem unnatural, it's normal for a few companies to account for the majority of the stock market's annual gains. From 1994 to 2014, the top 6 stocks in the SPX (which is only 1% of the total) accounted for an average of 33% of the index's gain in any year; the top 20 stocks (only 4% of the total) accounted for an astounding 68% of the index's gain.
In other words, it is common for a relatively few number of stocks to disproportionately carry the indices higher. Collectively, 96% of stocks will often lag. More on this here (from Cliff Asness of AQR Capital Management).
Right now, it's hard to make the case that the rest of the stock market is doing poorly. An equal-weight index of the S&P - which reduces the importance of the top 5 to just 1% of the total - is on pace for a 10% gain in 2018. It closed Thursday at the second highest level in its history. That's a good representation of how the average stock is doing so far this year.
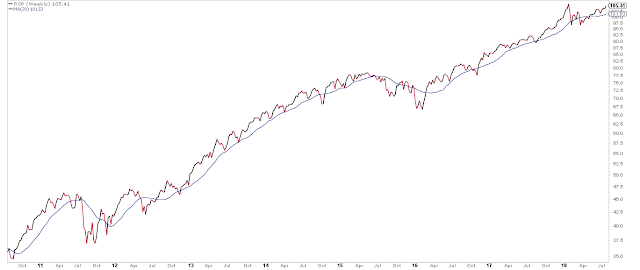
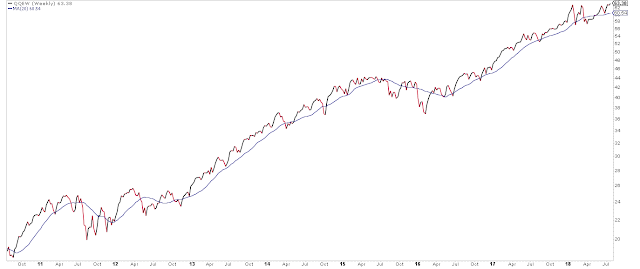
An equal-weight index of the Nasdaq - where non-FAAMG stocks have a 95% weighting - is already at a new all-time high and on pace for a 16% gain in 2018.
In summary, the 5 largest stocks are big (but not unusually so) and outperforming most other stocks (which is how they came to be in the top 5). All of this is normal. Over time, stock indices have typically been driven higher by a small number of stocks. And over time, those leaders have continually change. This is the story of the stock market. Right now, most stocks are doing fine: an index in which non-FAAMG stocks have a 99% weighting closed at the second highest level in its history today.
https://fat-pitch.blogspot.com/2018/07/the-top-5-stocks-are-big-and-theyre.html
• DiscoverGold
By: Urban Carmel | July 26, 2018
Summary: The 5 largest stocks comprise about 16% of the S&P 500. That's normal. In fact, the importance of the top 5 stocks was far greater in the 1970s than anytime in the past 5 years.
It's true that today's top 5 stocks - known by the acronym FAAMG - have largely outperformed most other stocks. That's how they became today's top 5. Over time, stock indices have typically been driven higher by a small number of stocks. And over time, those leaders have continually changed. This is the story of the stock market. Only one of today's top 5 was also in the top 5 in 2013. At the height of the tech bubble in 2000, the top 5 were companies like GE, Exxon, Pfizer, Citigroup and Cisco.
Right now, most stocks are doing fine: an index in which non-FAAMG stocks have a 99% weighting closed at the second highest level in its history today. It's on pace for a 10% gain in 2018.
* * *
The 5 biggest stocks in the S&P 500 - known by the acronym FAAMG - are equal to the smallest 282 stocks. Enlarge any chart by clicking on it (from Michael Batnick).

Note that this does not mean that the these 5 stocks are equal to half the index. Instead, they equal about 16% of the S&P (from Jack Gavigan).

Is this concentration an extreme? The top 5 stocks had a higher weighting in March 2000 and about the same weighting in June 2007. These were bull market highs, so this seems worrisome. But the weighting was was also higher in March 2009, a bear market low (from @EconomPic).

In fact, over time, the top 5 stocks (gray line) usually have a higher weighting than the smallest half of the index (blue line). The importance of the top 5 stocks was far greater in the 1970s than anytime in the past 5 years (from NDR Research).

Now, it's true that the FAAMG stocks have outperformed the rest of the index, and that their weighting has therefore doubled in the past 5 years (from Michael Batnick).

But that is not the same as saying the top 5 stocks have doubled their weighting. As NDR's research shows, the top 5 have increased their weighting by about 1/3. What accounts for the difference? Survivorship bias. Today's top 5 have, by definition, largely outperformed most stocks. That's how they became today's top 5.
Only 1 of today's top 5 was in the top 5 in 2013: Apple. The other top 5 companies in the US were Exxon, Berkshire, Walmart and GE. Google, Amazon and Facebook were not even the Global top 10 in 2013. And previous heavy weights, like Wells Fargo, IBM, Walmart and Chevron have completely fallen off the list. Today's behemoths are obvious only in hindsight (from @tableaupublic).

This is the story of the stock market. Over time, the leaders change. In 1980, 7 of the top 10 in the US were in the oil and gas industry. At the height of the tech bubble in 2000, the top 5 were companies like GE, Exxon, Pfizer, Citigroup and Cisco (from Ben Carlson).

One constant in the stock market is the worry about concentration. It's hard to believe now but the dominance of IBM used to be a concern. Alone, it was more than 6% of the S&P in 1985 and it dominated the computer and software business in ways that seemed insurmountable to competitors and investors at the time. But new leaders emerged, the previous behemoth was put aside and the stock market was largely unaffected (from the Economist).

While it might seem unnatural, it's normal for a few companies to account for the majority of the stock market's annual gains. From 1994 to 2014, the top 6 stocks in the SPX (which is only 1% of the total) accounted for an average of 33% of the index's gain in any year; the top 20 stocks (only 4% of the total) accounted for an astounding 68% of the index's gain.
In other words, it is common for a relatively few number of stocks to disproportionately carry the indices higher. Collectively, 96% of stocks will often lag. More on this here (from Cliff Asness of AQR Capital Management).

Right now, it's hard to make the case that the rest of the stock market is doing poorly. An equal-weight index of the S&P - which reduces the importance of the top 5 to just 1% of the total - is on pace for a 10% gain in 2018. It closed Thursday at the second highest level in its history. That's a good representation of how the average stock is doing so far this year.

An equal-weight index of the Nasdaq - where non-FAAMG stocks have a 95% weighting - is already at a new all-time high and on pace for a 16% gain in 2018.

In summary, the 5 largest stocks are big (but not unusually so) and outperforming most other stocks (which is how they came to be in the top 5). All of this is normal. Over time, stock indices have typically been driven higher by a small number of stocks. And over time, those leaders have continually change. This is the story of the stock market. Right now, most stocks are doing fine: an index in which non-FAAMG stocks have a 99% weighting closed at the second highest level in its history today.
https://fat-pitch.blogspot.com/2018/07/the-top-5-stocks-are-big-and-theyre.html
• DiscoverGold
Information posted to this board is not meant to suggest any specific action, but to point out the technical signs that can help our readers make their own specific decisions. Your Due Dilegence is a must!
• DiscoverGold
Join the InvestorsHub Community
Register for free to join our community of investors and share your ideas. You will also get access to streaming quotes, interactive charts, trades, portfolio, live options flow and more tools.

