DP Alert: Dow Squeaks a PMO BUY Signal - ST Indicators Very Overbought By: Erin Swenlin | July 11, 2018
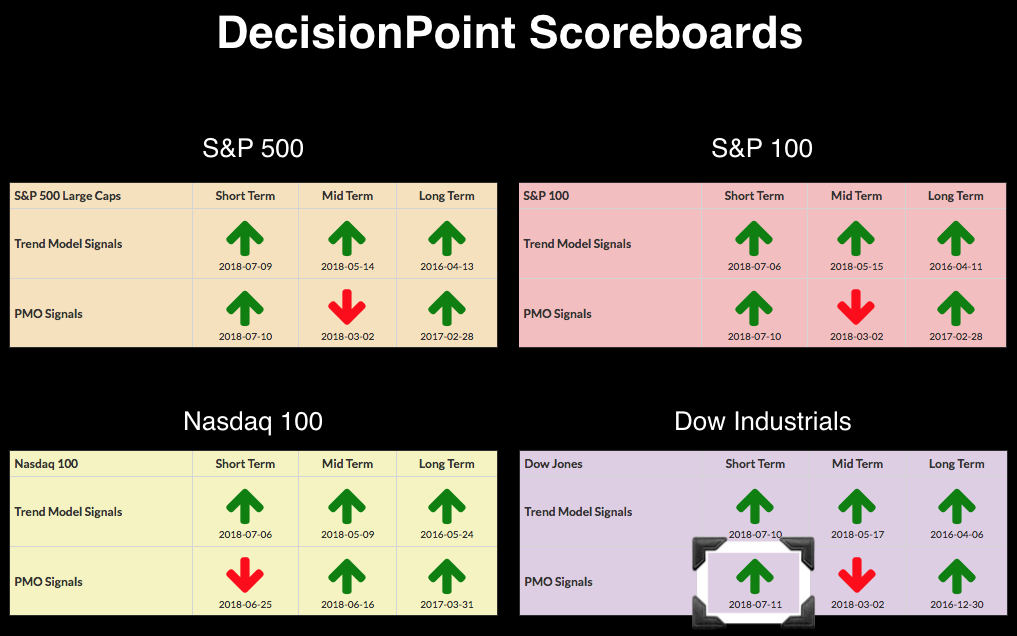
I mentioned in yesterday's blog that I was expecting the PMO BUY signals to come in on the Dow and NDX. Well, NDX missed the positive crossover by less than a tenth of a point, but I suspect it'll come in tomorrow barring a particularly bad day of selling. The Swenlin Trading Oscillators (STOs) remain extremely overbought, but appear to be topping. I'm expecting some sideways consolidation or perhaps a pullback.
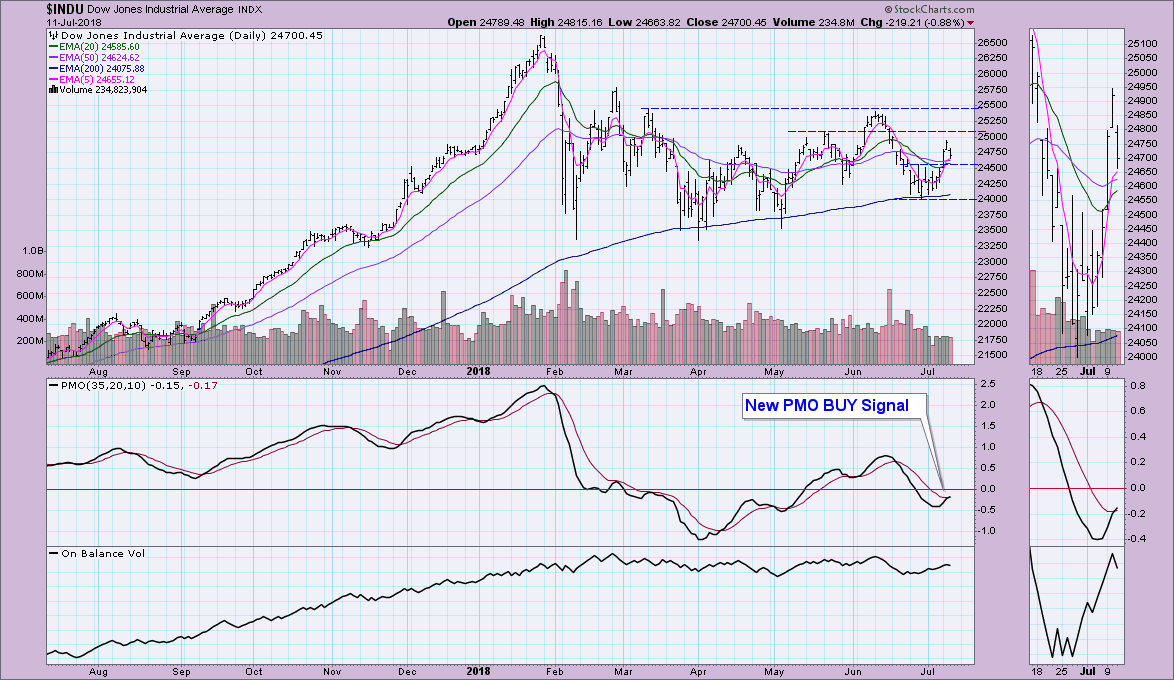
Looking at the Dow chart, we can see that the BUY signal did trigger, but the margin is very thin between the PMO and its signal line. Should we see a pullback instead of consolidation, it will most certainly fail. I expect to see consolidation between 24500 and 25200 based on the PMO BUY signal as well as the OBV trending higher.
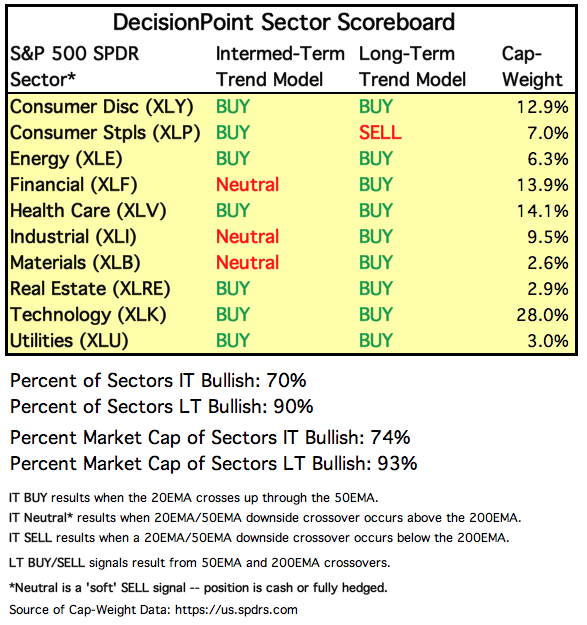
SECTORS
Each S&P 500 Index component stock is assigned to one, and only one, of 10 major sectors. This is a snapshot of the Intermediate-Term and Long-Term Trend Model signal status for those sectors.
STOCKS
IT Trend Model: BUY as of 5/11/2018
LT Trend Model: BUY as of 4/1/2016
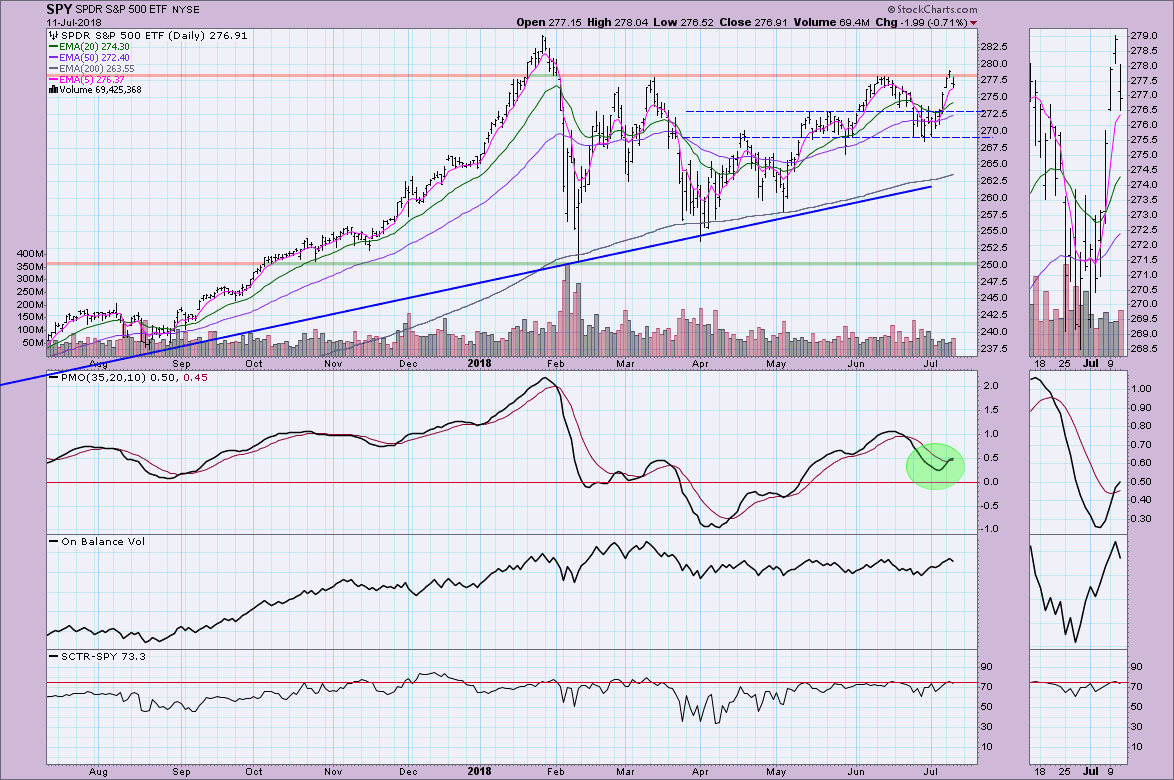
SPY Daily Chart: The failure to surpass overhead resistance at the June top isn't surprising when you look at the indicator charts below. The PMO is decelerating, but it should flatten out if we do see consolidation. Look for consolidation between 272.50 and 277.50 for the SPY. That is a fairly large zone and would require a somewhat painful drop to test that area of support at 272.50 so perhaps the 20-EMA will provide the necessary support for a consolidation zone.
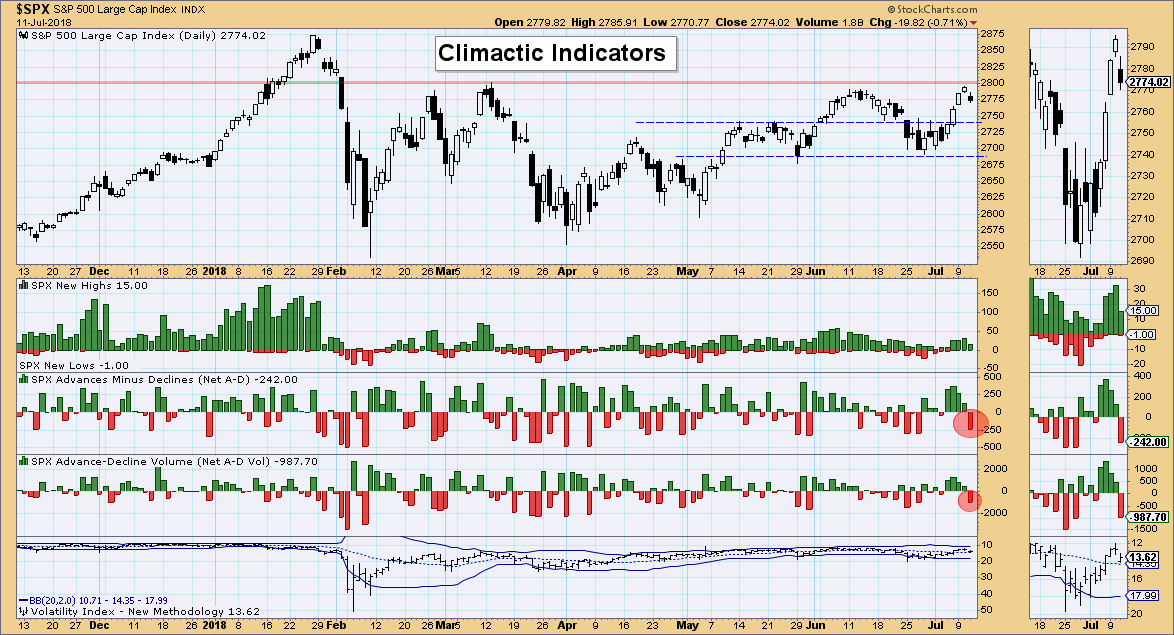
Climactic Market Indicators: Breadth today suggests a selling initiation. The VIX is sitting in the middle of the Bollinger Bands so sentiment won't likely play a role in the possible decline or consolidation.
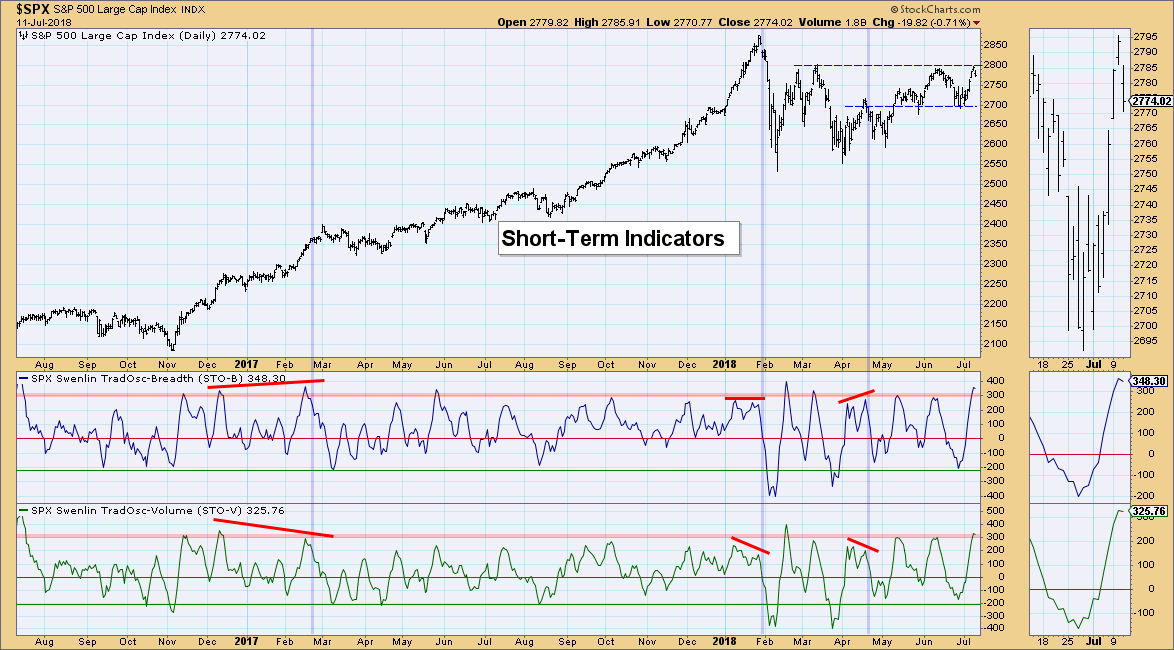
Short-Term Market Indicators: These are the indicators that have me concerned. On the bright side, both are topping above their previous tops. Note that when the STO-V shows declining tops, that usually leads to a difficult decline. I'm still looking for some consolidation in the short term.
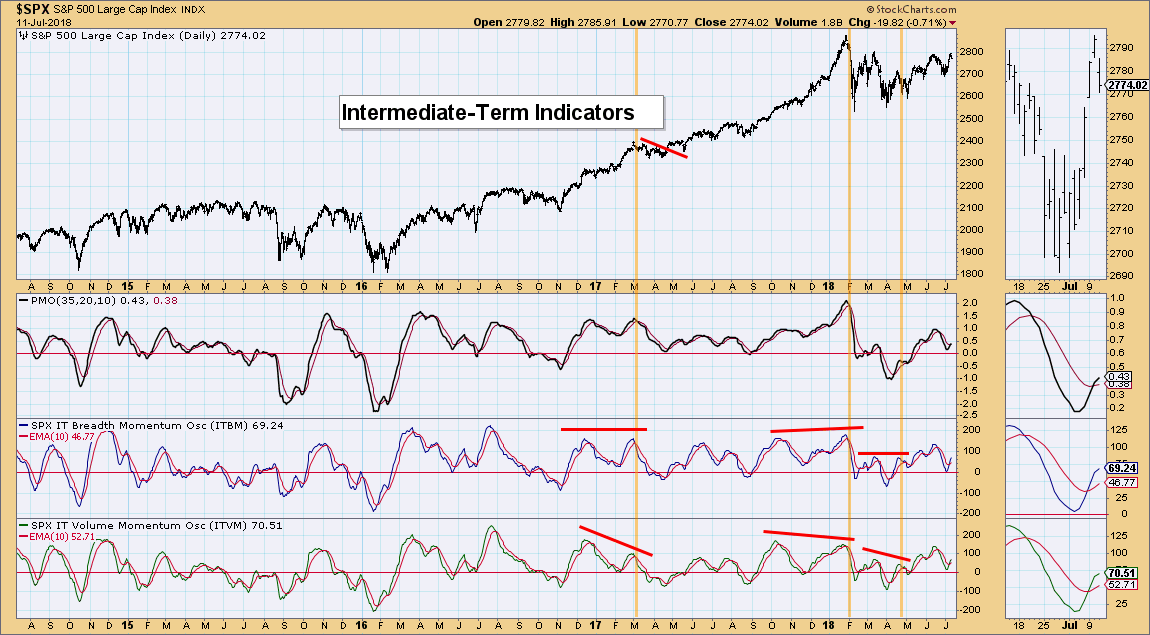
Intermediate-Term Market Indicators: These indicators are looking very promising. While they are decelerating, they managed positive crossovers above the zero line and have plenty of room to support a rally to all-time highs once this short-term weakness is dispensed with.
Conclusion: Short-term conditions are very overbought. The indexes are in a bull market configuration (50-EMAs well above 200-EMAs) and are now on PMO BUY signals (minus the NDX). Remember bull market rules tell us that overbought conditions can work themselves out with consolidation. That's exactly what I'm looking for. Once those overbought conditions are clearing or are cleared, IT indicators tell us to expect a rally possibly to all-time highs again.
Information posted to this board is not meant to suggest any specific action, but to point out the technical signs that can help our readers make their own specific decisions. Your Due Dilegence is a must! • DiscoverGold
Register for free to join our community of investors and share your ideas. You will also get access to streaming quotes, interactive charts, trades, portfolio, live options flow and more tools.


 News
News  Market Data
  Discover