


| Followers | 686 |
| Posts | 143035 |
| Boards Moderated | 35 |
| Alias Born | 03/10/2004 |
Sunday, July 01, 2018 7:17:56 PM
Weekly Market Summary
By: Urban Carmel | July 1, 2018
Summary: US equities are up three months in a row and positive for the year. Historically, equities have a very strong propensity to end the year higher under these circumstances. That remains our long term view.
Shorter-term, the S&P remains in a 5 month consolidation/trading range. These periods can last 6-12 months. July is a seasonal tailwind, and several sentiment indicators suggest a bias higher (to the top of the range) is warranted. On strength this month, beware; it is followed by the two worst months of the year.
* * *
US equities rose for a third month in a row in June. SPX and small caps gained 0.5% and NDX gained 1.1%. The laggard in the US is the Dow, which lost 0.5% in June.
The picture is not much different on YTD basis. At the year's mid-point, SPX is up 2.5%, NDX is up 10% and small caps are up 7%. The Dow is down almost 2%. Part of these results are explained by the upward bias in the dollar, which favors domestic-focused small caps relative to internationally-weighted large caps. Enlarge any chart by clicking on it.
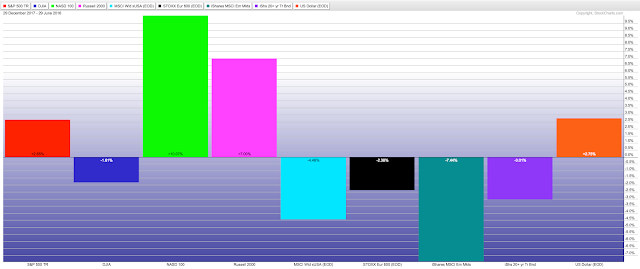
Note how the US is easily outperforming the rest of the world. Europe and Japan are down 2.4% and emerging markets are down 7.4%. This is despite the fact that the US Fed has been engaged in Quantitive Tightening (QT) while the central banks in Europe and Japan are still easing. This is not a surprising outcome (a post on this is here).

Our longer term view remains that US equities are in a bull market and that new highs (ATH) lie ahead in 2018. In fact, the Nasdaq and the small cap indices were at new ATHs just two weeks ago (June 20th).
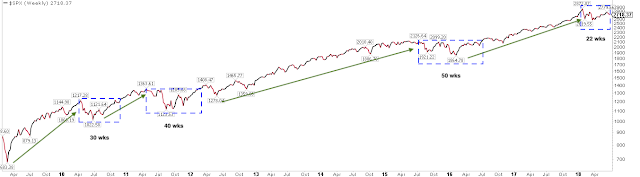
Shorter term, US large caps remain in a consolidation phase following the persistent grind higher in 2017. We discussed this several months ago. Extremes in momentum, volatility and sentiment from January are probably resetting before equities continue higher. This has been a repeating pattern during this (and every) bull market, with the time between new highs ranging from 30-50 weeks. The current consolidation feels interminable, but has been "just" 22 weeks. This could continue through the summer but should ultimately resolve higher.
The closest parallel to 2017 is 1995; in both cases, markets ground higher with the maximum intra-year correction being a scant 3%. 1996 started with a 9% gain in January (versus 7% in 2018); between February and September 1996 (30 weeks), equities chopped in a range and consolidated gains before resuming the trend in the 4th quarter. That same pattern could well repeat this year.
Nominally, equities are being held back by continuing trade ware rhetoric. Equities have looked poised to continue higher, only to be jammed by escalating trade demands and retaliation. It's hard to see large caps moving higher until this war of words ends. If this is a pre-election strategy, then stocks will likely remain rangebound for several months.
The FOMC also raised rates in mid-June. We expected this to negatively impact stocks, and it did. Aside from the rate hike in December (which came as the "tax reform" bill was passed), stocks have sold off following every rate hike since the tightening process started in 2015. The long term trend higher in equities (and yields) likely prevails.
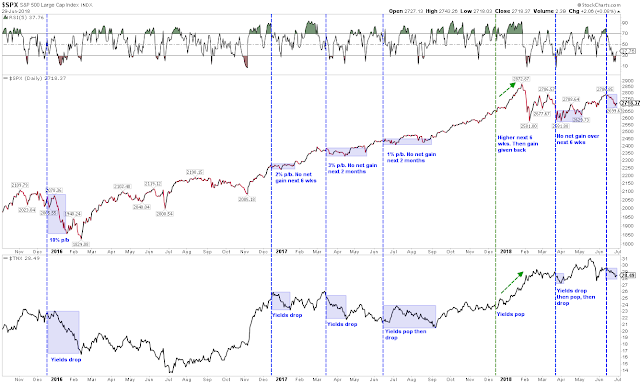
Recall that since 1980, the high in equities (NYSE) has come after the last rate hike. Why? Because rising rates indicate an economy that is strong, with expanding growth, incomes, consumption and profits. Under these circumstances, equities should rise.
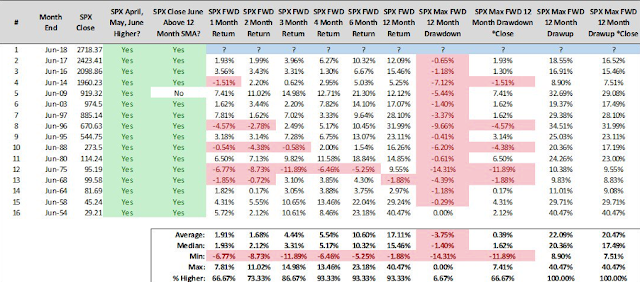
Despite all of this, SPX has risen 3 months in a row, every month of 2Q. Historically, when stocks rise during this period, they have risen the next 4, 6 and 12 months in 15 of 16 instances (94%). Risk/reward over the next 12 months has been highly favorable (from Steve Deppe, here).
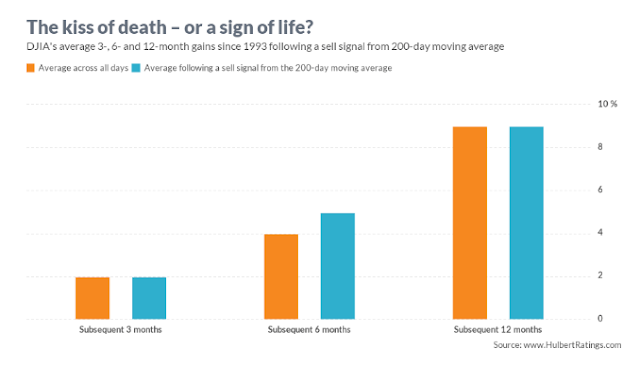
It's true that the Dow has lagged the other indices. This week, it even suffered a "Death Cross", where its 50-d crossed under its 200-d. This means that trading over the past two months is weaker than over the prior 9 months. Is this as bearish as the name implies? No; forward performance is mostly inline with anytime returns for the Dow, and 6-month returns are even a bit better than normal. In other words, the Death Cross tends to mark a shakeout (from Mark Hulbert).
Sentiment indicators had been showing excessive bulls in early June, one reason we expected stocks to retreat (here). But trade tensions (and the ongoing choppy consolidation) has recently delivered a hit to sentiment.
Last week, equity mutual fund and ETF fund outflows were a massive $20b, one the largest of this bull market. These have typically come near at least short term lows in SPX (arrows indicate outflows greater than $15b). The last large outflow occurred the first week in February, which marked the low for SPX so far in 2018 (from Lipper).

>>> Read More…
• DiscoverGold
Click on "In reply to", for Authors past commentaries
By: Urban Carmel | July 1, 2018
Summary: US equities are up three months in a row and positive for the year. Historically, equities have a very strong propensity to end the year higher under these circumstances. That remains our long term view.
Shorter-term, the S&P remains in a 5 month consolidation/trading range. These periods can last 6-12 months. July is a seasonal tailwind, and several sentiment indicators suggest a bias higher (to the top of the range) is warranted. On strength this month, beware; it is followed by the two worst months of the year.
* * *
US equities rose for a third month in a row in June. SPX and small caps gained 0.5% and NDX gained 1.1%. The laggard in the US is the Dow, which lost 0.5% in June.
The picture is not much different on YTD basis. At the year's mid-point, SPX is up 2.5%, NDX is up 10% and small caps are up 7%. The Dow is down almost 2%. Part of these results are explained by the upward bias in the dollar, which favors domestic-focused small caps relative to internationally-weighted large caps. Enlarge any chart by clicking on it.

Note how the US is easily outperforming the rest of the world. Europe and Japan are down 2.4% and emerging markets are down 7.4%. This is despite the fact that the US Fed has been engaged in Quantitive Tightening (QT) while the central banks in Europe and Japan are still easing. This is not a surprising outcome (a post on this is here).

Our longer term view remains that US equities are in a bull market and that new highs (ATH) lie ahead in 2018. In fact, the Nasdaq and the small cap indices were at new ATHs just two weeks ago (June 20th).
Shorter term, US large caps remain in a consolidation phase following the persistent grind higher in 2017. We discussed this several months ago. Extremes in momentum, volatility and sentiment from January are probably resetting before equities continue higher. This has been a repeating pattern during this (and every) bull market, with the time between new highs ranging from 30-50 weeks. The current consolidation feels interminable, but has been "just" 22 weeks. This could continue through the summer but should ultimately resolve higher.

The closest parallel to 2017 is 1995; in both cases, markets ground higher with the maximum intra-year correction being a scant 3%. 1996 started with a 9% gain in January (versus 7% in 2018); between February and September 1996 (30 weeks), equities chopped in a range and consolidated gains before resuming the trend in the 4th quarter. That same pattern could well repeat this year.

Nominally, equities are being held back by continuing trade ware rhetoric. Equities have looked poised to continue higher, only to be jammed by escalating trade demands and retaliation. It's hard to see large caps moving higher until this war of words ends. If this is a pre-election strategy, then stocks will likely remain rangebound for several months.
The FOMC also raised rates in mid-June. We expected this to negatively impact stocks, and it did. Aside from the rate hike in December (which came as the "tax reform" bill was passed), stocks have sold off following every rate hike since the tightening process started in 2015. The long term trend higher in equities (and yields) likely prevails.

Recall that since 1980, the high in equities (NYSE) has come after the last rate hike. Why? Because rising rates indicate an economy that is strong, with expanding growth, incomes, consumption and profits. Under these circumstances, equities should rise.
Despite all of this, SPX has risen 3 months in a row, every month of 2Q. Historically, when stocks rise during this period, they have risen the next 4, 6 and 12 months in 15 of 16 instances (94%). Risk/reward over the next 12 months has been highly favorable (from Steve Deppe, here).

It's true that the Dow has lagged the other indices. This week, it even suffered a "Death Cross", where its 50-d crossed under its 200-d. This means that trading over the past two months is weaker than over the prior 9 months. Is this as bearish as the name implies? No; forward performance is mostly inline with anytime returns for the Dow, and 6-month returns are even a bit better than normal. In other words, the Death Cross tends to mark a shakeout (from Mark Hulbert).

Sentiment indicators had been showing excessive bulls in early June, one reason we expected stocks to retreat (here). But trade tensions (and the ongoing choppy consolidation) has recently delivered a hit to sentiment.
Last week, equity mutual fund and ETF fund outflows were a massive $20b, one the largest of this bull market. These have typically come near at least short term lows in SPX (arrows indicate outflows greater than $15b). The last large outflow occurred the first week in February, which marked the low for SPX so far in 2018 (from Lipper).

>>> Read More…
• DiscoverGold
Click on "In reply to", for Authors past commentaries
Information posted to this board is not meant to suggest any specific action, but to point out the technical signs that can help our readers make their own specific decisions. Your Due Dilegence is a must!
• DiscoverGold
Join the InvestorsHub Community
Register for free to join our community of investors and share your ideas. You will also get access to streaming quotes, interactive charts, trades, portfolio, live options flow and more tools.

