


| Followers | 689 |
| Posts | 143817 |
| Boards Moderated | 35 |
| Alias Born | 03/10/2004 |
Monday, May 21, 2018 8:12:11 AM
Weekly Market Summary
By: Urban Carmel | May 20, 2018
Summary: Equities are 2-5% higher so far in May, trying to add to their small gains from April and put behind a rough winter. This week, small caps closed at a new all-time high (ATH) and NDX broke to a 7 week high near its March ATH. This is constructive for the broader market. But new uptrends are defined by persistent strength; it's time for large caps to reveal the true character of this market.
* * *
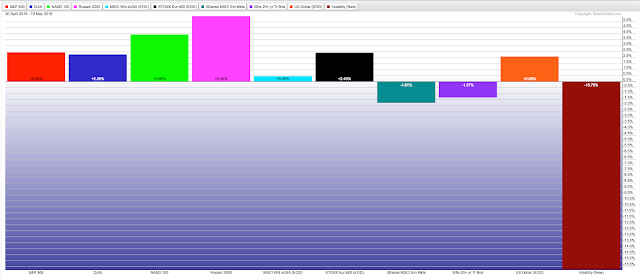
US equities fell slightly last week. SPX and DJIA lost about 0.5%. But May, so far, is tracking positive. Large caps are up 2.5%, tech stocks are up 4% and small caps are up more than 5%. The volatility index, Vix, has been crushed. Enlarge any chart by clicking on it.
Recall April ended with a minor gain after falling in both February and March. So, equities are making an attempt to reassert their prior uptrend after a rough winter.
We laid out our longer term perspectives in our last weekly update (here). In summary:
US equities have been in a consolidation phase for most of 2018. In the past, these consolidation periods have lasted a half year or longer - so this might continue into summer.
New highs are very likely to still lie ahead in 2018. This is still a bull market.
SPX reached its highest level since March this week. It is 6% off its YTD low and also 6% from its YTD high. Objectively, it's still in a consolidation phase. The next big battle to the upside is at 2800, a level it has tried to breach just once since plunging through it February 1st.
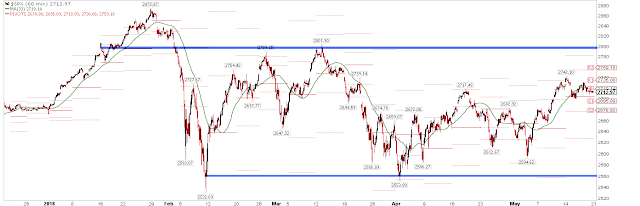
A good start to the week ahead is important. Last week ended with two down closes, pushing SPX below its now flat 5-dma (green line above). The weekly pivot (2720) is also above Friday's close. Uptrends mostly remain above the weekly pivot. Momentum is also nearing 'oversold'; uptrends rarely stay oversold for long and spend most of their time overbought. So, the character of the market will probably be revealed early this week.
SPX also ended last week right on its rising 20-weekly MA (blue line). SPX has a strong tendency to trend higher above this moving average (and to be choppy and corrective below it). Closing this pre-holiday week at least flat is thus important, moving the weekly MACD closer to a positive cross (lower panel).

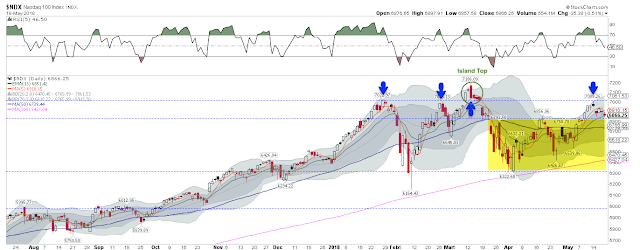
The action in the NDX is encouraging; it broke to a 7 week high this week and made its first test of the March "Island Top" gap at 7020 (arrows). SPX typically follows NDX. Watch for NDX to stay above 6800 on weakness; below that and it reenters the hot mess from April and early May, a bad sign. A close above 7020 opens up a test of the March high and, more likely, new highs for both NDX and SPX.
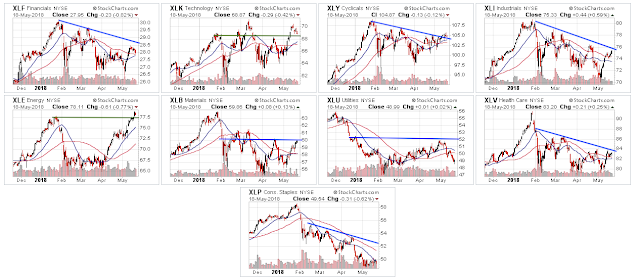
There is not much hidden strength at the sector level. Energy is at a YTD high and technology is also close to being so, but the other sectors have not exceeded their pivot highs from the past 1-2 months.
Small caps (RUT) broke out to a new all-time high this week. That would seem to be a sign of strength for the broader market, as this index comprises 2000 companies. But it has, historically, meant little: the forward odds of SPX moving higher are neutral (from Quantifiable Edges, here).
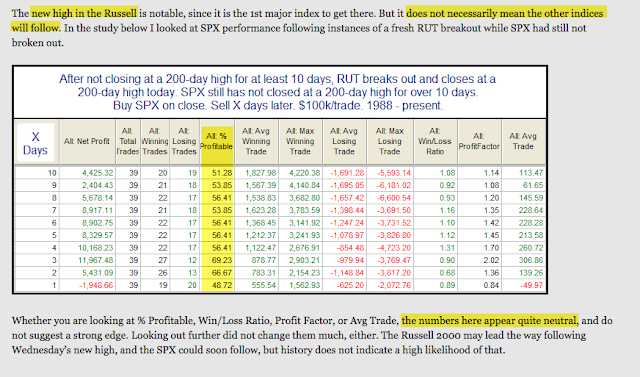
That should not be surprising. RUT is a much smaller index than SPX. SPX represents about 76% of the total market capitalization of US equities. RUT is just 9%. The 6 largest components of the DJIA have a greater combined market capitalization than all 2000 components of the RUT. It's not clear why a small subset of stocks should be expected to provide more useful insight on the health of US equities than SPX itself. And, in fact, history suggests they do not.
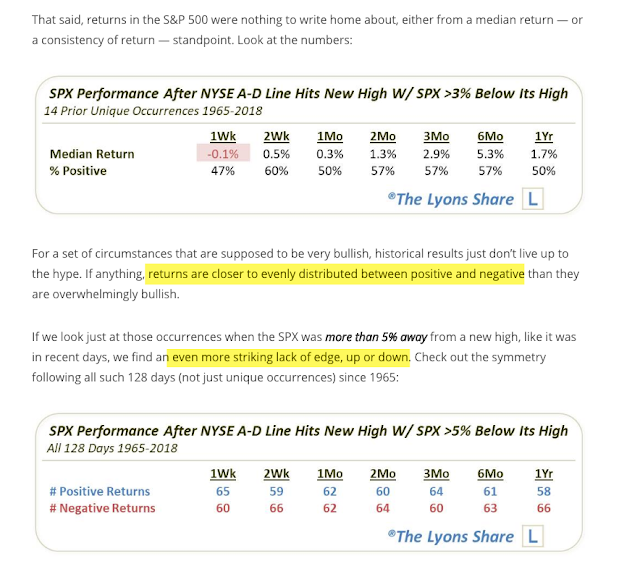
Likewise, that the advance-decline line of the NYSE made a new high this week has, historically, meant little to the forward returns for SPX. A month later, SPX was just as likely to be higher as lower. That's striking, as SPX is naturally higher in 60% of all months and 68% of all 3 month periods (from Dana Lyons, here).
>>> Read More
• DiscoverGold
By: Urban Carmel | May 20, 2018
Summary: Equities are 2-5% higher so far in May, trying to add to their small gains from April and put behind a rough winter. This week, small caps closed at a new all-time high (ATH) and NDX broke to a 7 week high near its March ATH. This is constructive for the broader market. But new uptrends are defined by persistent strength; it's time for large caps to reveal the true character of this market.
* * *
US equities fell slightly last week. SPX and DJIA lost about 0.5%. But May, so far, is tracking positive. Large caps are up 2.5%, tech stocks are up 4% and small caps are up more than 5%. The volatility index, Vix, has been crushed. Enlarge any chart by clicking on it.

Recall April ended with a minor gain after falling in both February and March. So, equities are making an attempt to reassert their prior uptrend after a rough winter.
We laid out our longer term perspectives in our last weekly update (here). In summary:
US equities have been in a consolidation phase for most of 2018. In the past, these consolidation periods have lasted a half year or longer - so this might continue into summer.
New highs are very likely to still lie ahead in 2018. This is still a bull market.
SPX reached its highest level since March this week. It is 6% off its YTD low and also 6% from its YTD high. Objectively, it's still in a consolidation phase. The next big battle to the upside is at 2800, a level it has tried to breach just once since plunging through it February 1st.

A good start to the week ahead is important. Last week ended with two down closes, pushing SPX below its now flat 5-dma (green line above). The weekly pivot (2720) is also above Friday's close. Uptrends mostly remain above the weekly pivot. Momentum is also nearing 'oversold'; uptrends rarely stay oversold for long and spend most of their time overbought. So, the character of the market will probably be revealed early this week.
SPX also ended last week right on its rising 20-weekly MA (blue line). SPX has a strong tendency to trend higher above this moving average (and to be choppy and corrective below it). Closing this pre-holiday week at least flat is thus important, moving the weekly MACD closer to a positive cross (lower panel).

The action in the NDX is encouraging; it broke to a 7 week high this week and made its first test of the March "Island Top" gap at 7020 (arrows). SPX typically follows NDX. Watch for NDX to stay above 6800 on weakness; below that and it reenters the hot mess from April and early May, a bad sign. A close above 7020 opens up a test of the March high and, more likely, new highs for both NDX and SPX.

There is not much hidden strength at the sector level. Energy is at a YTD high and technology is also close to being so, but the other sectors have not exceeded their pivot highs from the past 1-2 months.

Small caps (RUT) broke out to a new all-time high this week. That would seem to be a sign of strength for the broader market, as this index comprises 2000 companies. But it has, historically, meant little: the forward odds of SPX moving higher are neutral (from Quantifiable Edges, here).

That should not be surprising. RUT is a much smaller index than SPX. SPX represents about 76% of the total market capitalization of US equities. RUT is just 9%. The 6 largest components of the DJIA have a greater combined market capitalization than all 2000 components of the RUT. It's not clear why a small subset of stocks should be expected to provide more useful insight on the health of US equities than SPX itself. And, in fact, history suggests they do not.
Likewise, that the advance-decline line of the NYSE made a new high this week has, historically, meant little to the forward returns for SPX. A month later, SPX was just as likely to be higher as lower. That's striking, as SPX is naturally higher in 60% of all months and 68% of all 3 month periods (from Dana Lyons, here).

>>> Read More
• DiscoverGold
Information posted to this board is not meant to suggest any specific action, but to point out the technical signs that can help our readers make their own specific decisions. Your Due Dilegence is a must!
• DiscoverGold
Join the InvestorsHub Community
Register for free to join our community of investors and share your ideas. You will also get access to streaming quotes, interactive charts, trades, portfolio, live options flow and more tools.

