


Saturday, May 19, 2018 2:49:38 PM
The Big Picture...here comes all the answers...
From May 11, 2018
Historically, the month of May is the second-weakest month of the year behind the month of September, but while corporate earnings for last quarter have been impressive, largely due to the tax cut adjustments, investors are starting to see something is very wrong with the stock market’s trend. Meanwhile, the Fed is draining massive amounts of capital out of the banking system and raising interest rates and that spells big problems ahead. We saw this development coming several quarters ago but we haven’t begun to see a bear market yet. Once the primary trend is incapable of trending above its 200-day moving averages, waves of sell programs will descend upon the market as the next bear market begins. Prepare for that as an opportunity.
When bull markets end, they take on a different technical look.
Rather than trending in a pattern of higher highs and higher lows and spending the majority of the time trending above 50-day moving averages and well above 200-day moving averages, they begin to transition into a different technical pattern.
Price challenges the 200-day moving average, breaking below it then swinging back up to resistance at the 50-day moving average. In this transitional stage, stocks are very volatile, bouncing up and down like in a game of ping pong between the bulls and bears in a struggle over dominance of converging support and resistance trend lines.
******If the indexes struggle to trend above their 50-day moving averages they compress closer to their 200-day moving averages and in time we begin to see the 50-day moving average start to descend towards the 200-day moving average.
The bulls must defend price and muster enough buying power to bust out of the bearish formation, reasserting a pattern of higher highs for the technical pattern to change, but for now the bears are gaining increasing strength as investors sell into strength on each rally attempt.

Like I said yesterday...the 50day looks like the test...and the BULLS best step UP
 3
3
Continue...
All major technical formations are led by fundamentals, so it is crucial to understand what causes economic contractions that lead to bear markets.
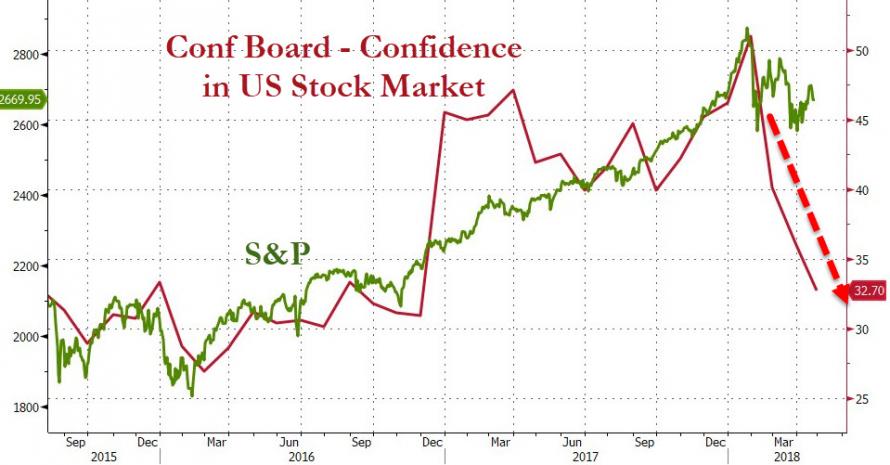
Both fundamentals and technicals screamed at us that we were at a major market top in January. Do you remember that “market confidence” in the U.S. stock market was at an all-time high? People’s optimism was off the charts.
TREASURY DRAINING LIQUIDITY AND WHAT THAT MEANS
We have been bracing ourselves for rough waters to begin after April 17th (tax day). Notice this was indeed the high for the month of April in the major indexes as I thought it would be last month!
It was a really easy call because after this date, the Federal Reserve was scheduled to drain $30 billion out of the markets after it collected income taxes in the final week via its balance sheets shrinkage program.
It will also drain another $30 billion again in the month of May (around the third week or so, based on the pattern) and investors will be questioning the wisdom of getting long stocks with the Fed draining like this.
The dynamics of draining the Fed’s balance sheet are important to understand in relation to how liquidity is impacted.
When the central bank (The Fed) drains reserves from the banking system it does it by “selling” government debt that it owes out of its balance sheet. It sells this debt to the 12 Federal Reserve Banks that are independent entities. They have their own balance sheets and are separate from the U.S. Treasury.
Therefore, when the central bank is the seller of some $30 billion in a given month, it means that the 12 Federal Reserve Banks are the buyers. This creates a transfer of capital.
When this happens, cash or the money supply is taken out of the 12 Fed banks and given to the central bank (the Fed) and in return the 12 banks get the government securities.
This means there is $30 billion less to lend to primary dealers/investment banks, the exact opposite of when the Fed was pumping liquidity in a quantitative easing program we saw under the Obama administration.
Consequently, stocks struggle as buying power wanes and a bearish trend begins to develop.
Even though corporate earnings last quarter were impressive for some of the high-profile companies, the bulls just don’t have the kind of capital they had in 2017.
***It is no longer about the prior quarterly corporate earnings announcements, but investment banks, which have always been the principal buyers of stocks, and their concern about obtaining liquidity in the future.
Furthermore, the Fed is actually forcing the Treasury to sell additional debt to raise the cash to pay off the holdings that the Fed is now selling each month!
****This is the new fundamental factor and it is affecting the technicals of the stock market indexes.
In the first quarter of 2018, the Fed sold $20 billion per month, or $60 billion, but beginning in April this was pushed to $30 billion, with the Fed selling $30 billion again in May and June. Then in July, August, and September, the Fed will increase this selling to $40 billion. It then goes to $50 billion per month from October through the rest of the year and through 2019.

Sometime in 2020, the Fed hopes to reach “normalization”, but by then we should have a rather nasty bear market as we slide into the next Presidential election!
As the Fed sells more government debt it has a profound effect on interest rates with government yields soaring. We are now very close to seeing the yields invert (short-term Treasury yields catching up to long-term Treasury yields is called a flat yield curve and when short yield exceeds long-term yields it causes recessions).
This is why the yield curve matters so much now.

When the 10-year yield curve presses to 3.0% as it has now, it is challenging a descending trend line that began back in 1980 (blue line), when inflation was outrageous but our national debt was minimal.
Should the 10-year Treasury yield breach above 3% on $21 trillion the interest will start to average $630 billion. At 3.5% it jumps to $735 billion. Something has to give when interest on the national debt gets this high.

Currently, the U.S. Treasury is sucking hundreds of billions out of the worldwide liquidity pool that fuels financial asset purchases and this is sure to get worse with the most recent budget deal that will add massively to the national debt. This will force the Treasury to issue more debt to cover the shortfall and that sucks more capital out of the capital markets in the months ahead.
The jury is still out on whether tax cuts can overcome the Federal Reserve tightening monetary policies but it never has in the past!
PROFIT CYCLE PEAKING
This is the worst start to the second quarter since the Great Depression. Notice how the President is no longer taking credit for the stock market’s performance!
We are now close to the Minsky moment when a sudden collapse of asset values is part of the credit or business cycle and that comes when all technical supports are breached and sell stops are triggered on margined positions.

This chart illustrates the negative balance or what is on margin that investors have comparably since 1995. Notice that in the recession of 2000-2002 and in the recession of 2008, the negative balance (Red), or what was on margin, went to a positive balance sharply and violently (Green).
Notice that since the Great Recession of 2008, assets on margin have gone ballistic.
When the market starts to break major long-term support and begins to develop a downtrend, investment banks’ risk substantially skyrockets.
Consequently, margin calls will be generated to maintain positions in a developing bear market and as stocks fall faster, more capital will be required to maintain margined long positions. This causes investment banks to automatically begin selling customers positions to maintain the proper ratios of capital on margin.
In fast market conditions with so much on margin and so much on the line for investment banks’ capital, the Minsky moment can happen very fast.
This can happen when corporate earnings are at their best or at “peak earnings.” When the stock market fails to rally on exceptionally good earnings releases it means investors are looking forward and not at last quarter’s earnings announcements.
Remember, corporate earnings always look the best at peak earnings at the top of the market and they always look the worst at the bottom of the economic cycle.
This is the chart showing all the recessions predicted by the Fed.

Impressive chart wasn't it? The Fed isn’t in the business of forewarning of recessions! It is in the business of protecting big banks, which means misleading about oncoming recessions.
Oil...Dollar
We’ve had seven consecutive quarters of accelerating growth, largely because of two principle factors — a plunging U.S. dollar and rising crude oil prices.
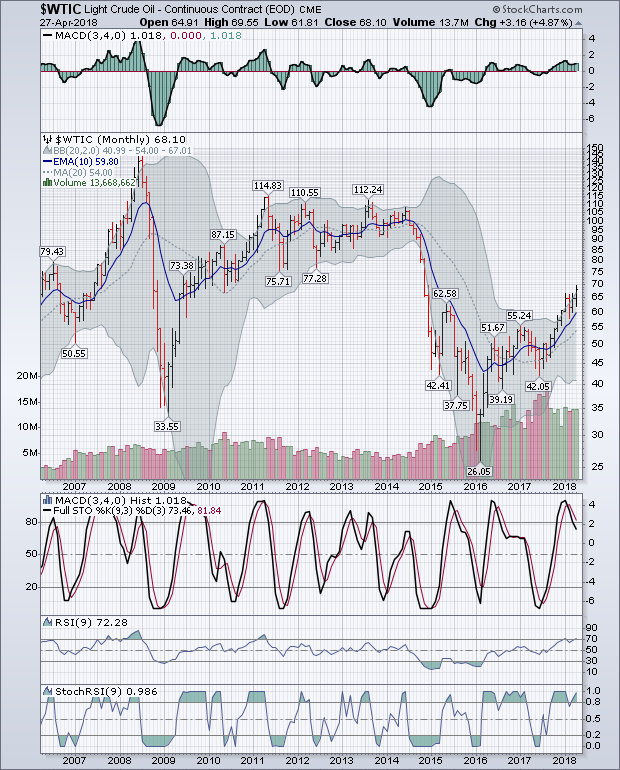
The leading sector within the S&P 500 index has been the energy sector. Though cash flow for oil majors is set to be the highest in 12 years, stocks have largely fallen out of favor because of fears that abundant supply will soon face a peak in demand. These earnings are clearly not sustainable!
With the Fed drying up liquidity by draining or selling Treasury bonds, yields cut off the supply of money. That, along with higher interest rates, will soon slow the economy down and cut off the demand for energy.
IS THE U.S. DOLLAR BOTTOMING?
One of the first things President Trump did when he came to office was to start to fight economic battles for the U.S. and in part this began with a plunge in the U.S. dollar to make U.S. goods more competitive.
The bearish downtrend in the U.S. dollar relative to the euro has made European goods very expensive and it is hurting the European economy and other economies. Notice what has been happening globally since the first of the year.

Much of this is related to the U.S. dollar being weak for much of last year but, most recently, the U.S. dollar has been picking up momentum and was challenging its 200-day moving average at the end of April.

However, though the U.S. dollar has recently rallied, it still remains in a bear market. If the U.S. dollar turns back down again, European goods will continue to climb in price, but if the dollar continues to rally, crude oil prices will peak and turn down.
French President Emmanuel Macron was in Washington at the end of April to discuss with President Trump, principally, the Iranian nuclear deal.
Macron was leading an effort by France, Britain, and Germany to find a fix in hopes of persuading the President not to abandon the Iranian nuclear agreement.
The EU is getting cheap Iranian oil and Europe would like that to continue. President Trump wants to stop enriching Iran and Russia and to import U.S. oil to Europe.
Therefore, President Trump wants Iran to not only submit to nuclear inspections, but to stop its ballistic missile program. However, what the U.S. wants most of all is to stop the “sunset” provision in the current Iranian deal that Obama allowed that gives the nuclear bomb to Iran in a few years.
(***oil wars...currency wars...trade wars...war wars...
As we now know, [color=red]Trump has backed out of the deal
Oil surged in April over concerns that should Trump tear up the Iranian Nuclear deal, as many as 1 million barrels of Iranian exports would be eliminated from the market as a result of a return to trade sanctions.
Remember, Iran, Russia, and China are bypassing the U.S. dollar to trade in oil in the petroyuan, sidestepping the petrodollar.[/color] The U.S. is determined to fight back. ...WAR???
We are in an economic war and I figure because Iran, Russia, and China have ditched the petrodollar, President Trump will look to strike a new deal with more solid foundations.
In a stern warning to Iran, President Trump said that if Iran ever threatens the United States, “they will pay a price like few countries have ever paid.”
Thousands of U.S. troops and marines have recently arrived in Jordan, near Syria.
Higher gasoline prices are now hurting the consumer. It drains capital from the economy at a time when the Fed is draining capital from the banking system. That’s a dangerous combination.
...suggests that.....the U.S. wants the U.S. dollar to rally now to bring down oil prices to cut into the income streams of Iran, Russia, and China.
***************************************************************
I said yesterday I thought the FED could slow down the rate hikes and no third hike this year...well maybe the FED best slow down it's balance sheet tapering...to take it up to $40-50 billion a month...that's insane for the Markets. (...the other side of the INSANE coin had the FED pumping $85 Billion a month into the Markets to save us...I mean save the BankerCrooks...and the WallStreet casino...
And I said I wasn't worried until Sept/Oct...well maybe I should start to worry a little sooner.
I got some silver today...not a lot but some...
Enjoy...roller coaster ride...
From May 11, 2018
Historically, the month of May is the second-weakest month of the year behind the month of September, but while corporate earnings for last quarter have been impressive, largely due to the tax cut adjustments, investors are starting to see something is very wrong with the stock market’s trend. Meanwhile, the Fed is draining massive amounts of capital out of the banking system and raising interest rates and that spells big problems ahead. We saw this development coming several quarters ago but we haven’t begun to see a bear market yet. Once the primary trend is incapable of trending above its 200-day moving averages, waves of sell programs will descend upon the market as the next bear market begins. Prepare for that as an opportunity.
When bull markets end, they take on a different technical look.
Rather than trending in a pattern of higher highs and higher lows and spending the majority of the time trending above 50-day moving averages and well above 200-day moving averages, they begin to transition into a different technical pattern.
Price challenges the 200-day moving average, breaking below it then swinging back up to resistance at the 50-day moving average. In this transitional stage, stocks are very volatile, bouncing up and down like in a game of ping pong between the bulls and bears in a struggle over dominance of converging support and resistance trend lines.
******If the indexes struggle to trend above their 50-day moving averages they compress closer to their 200-day moving averages and in time we begin to see the 50-day moving average start to descend towards the 200-day moving average.
The bulls must defend price and muster enough buying power to bust out of the bearish formation, reasserting a pattern of higher highs for the technical pattern to change, but for now the bears are gaining increasing strength as investors sell into strength on each rally attempt.
Like I said yesterday...the 50day looks like the test...and the BULLS best step UP
Continue...
All major technical formations are led by fundamentals, so it is crucial to understand what causes economic contractions that lead to bear markets.
Both fundamentals and technicals screamed at us that we were at a major market top in January. Do you remember that “market confidence” in the U.S. stock market was at an all-time high? People’s optimism was off the charts.

TREASURY DRAINING LIQUIDITY AND WHAT THAT MEANS
We have been bracing ourselves for rough waters to begin after April 17th (tax day). Notice this was indeed the high for the month of April in the major indexes as I thought it would be last month!
It was a really easy call because after this date, the Federal Reserve was scheduled to drain $30 billion out of the markets after it collected income taxes in the final week via its balance sheets shrinkage program.
It will also drain another $30 billion again in the month of May (around the third week or so, based on the pattern) and investors will be questioning the wisdom of getting long stocks with the Fed draining like this.
The dynamics of draining the Fed’s balance sheet are important to understand in relation to how liquidity is impacted.
When the central bank (The Fed) drains reserves from the banking system it does it by “selling” government debt that it owes out of its balance sheet. It sells this debt to the 12 Federal Reserve Banks that are independent entities. They have their own balance sheets and are separate from the U.S. Treasury.
Therefore, when the central bank is the seller of some $30 billion in a given month, it means that the 12 Federal Reserve Banks are the buyers. This creates a transfer of capital.
When this happens, cash or the money supply is taken out of the 12 Fed banks and given to the central bank (the Fed) and in return the 12 banks get the government securities.
This means there is $30 billion less to lend to primary dealers/investment banks, the exact opposite of when the Fed was pumping liquidity in a quantitative easing program we saw under the Obama administration.
Consequently, stocks struggle as buying power wanes and a bearish trend begins to develop.
Even though corporate earnings last quarter were impressive for some of the high-profile companies, the bulls just don’t have the kind of capital they had in 2017.
***It is no longer about the prior quarterly corporate earnings announcements, but investment banks, which have always been the principal buyers of stocks, and their concern about obtaining liquidity in the future.
Furthermore, the Fed is actually forcing the Treasury to sell additional debt to raise the cash to pay off the holdings that the Fed is now selling each month!
****This is the new fundamental factor and it is affecting the technicals of the stock market indexes.
In the first quarter of 2018, the Fed sold $20 billion per month, or $60 billion, but beginning in April this was pushed to $30 billion, with the Fed selling $30 billion again in May and June. Then in July, August, and September, the Fed will increase this selling to $40 billion. It then goes to $50 billion per month from October through the rest of the year and through 2019.

Sometime in 2020, the Fed hopes to reach “normalization”, but by then we should have a rather nasty bear market as we slide into the next Presidential election!
As the Fed sells more government debt it has a profound effect on interest rates with government yields soaring. We are now very close to seeing the yields invert (short-term Treasury yields catching up to long-term Treasury yields is called a flat yield curve and when short yield exceeds long-term yields it causes recessions).
This is why the yield curve matters so much now.

When the 10-year yield curve presses to 3.0% as it has now, it is challenging a descending trend line that began back in 1980 (blue line), when inflation was outrageous but our national debt was minimal.
Should the 10-year Treasury yield breach above 3% on $21 trillion the interest will start to average $630 billion. At 3.5% it jumps to $735 billion. Something has to give when interest on the national debt gets this high.

Currently, the U.S. Treasury is sucking hundreds of billions out of the worldwide liquidity pool that fuels financial asset purchases and this is sure to get worse with the most recent budget deal that will add massively to the national debt. This will force the Treasury to issue more debt to cover the shortfall and that sucks more capital out of the capital markets in the months ahead.
The jury is still out on whether tax cuts can overcome the Federal Reserve tightening monetary policies but it never has in the past!
PROFIT CYCLE PEAKING
This is the worst start to the second quarter since the Great Depression. Notice how the President is no longer taking credit for the stock market’s performance!
We are now close to the Minsky moment when a sudden collapse of asset values is part of the credit or business cycle and that comes when all technical supports are breached and sell stops are triggered on margined positions.

This chart illustrates the negative balance or what is on margin that investors have comparably since 1995. Notice that in the recession of 2000-2002 and in the recession of 2008, the negative balance (Red), or what was on margin, went to a positive balance sharply and violently (Green).
Notice that since the Great Recession of 2008, assets on margin have gone ballistic.
When the market starts to break major long-term support and begins to develop a downtrend, investment banks’ risk substantially skyrockets.
Consequently, margin calls will be generated to maintain positions in a developing bear market and as stocks fall faster, more capital will be required to maintain margined long positions. This causes investment banks to automatically begin selling customers positions to maintain the proper ratios of capital on margin.
In fast market conditions with so much on margin and so much on the line for investment banks’ capital, the Minsky moment can happen very fast.
This can happen when corporate earnings are at their best or at “peak earnings.” When the stock market fails to rally on exceptionally good earnings releases it means investors are looking forward and not at last quarter’s earnings announcements.
Remember, corporate earnings always look the best at peak earnings at the top of the market and they always look the worst at the bottom of the economic cycle.
This is the chart showing all the recessions predicted by the Fed.

Impressive chart wasn't it? The Fed isn’t in the business of forewarning of recessions! It is in the business of protecting big banks, which means misleading about oncoming recessions.
Oil...Dollar
We’ve had seven consecutive quarters of accelerating growth, largely because of two principle factors — a plunging U.S. dollar and rising crude oil prices.

The leading sector within the S&P 500 index has been the energy sector. Though cash flow for oil majors is set to be the highest in 12 years, stocks have largely fallen out of favor because of fears that abundant supply will soon face a peak in demand. These earnings are clearly not sustainable!
With the Fed drying up liquidity by draining or selling Treasury bonds, yields cut off the supply of money. That, along with higher interest rates, will soon slow the economy down and cut off the demand for energy.
IS THE U.S. DOLLAR BOTTOMING?
One of the first things President Trump did when he came to office was to start to fight economic battles for the U.S. and in part this began with a plunge in the U.S. dollar to make U.S. goods more competitive.
The bearish downtrend in the U.S. dollar relative to the euro has made European goods very expensive and it is hurting the European economy and other economies. Notice what has been happening globally since the first of the year.

Much of this is related to the U.S. dollar being weak for much of last year but, most recently, the U.S. dollar has been picking up momentum and was challenging its 200-day moving average at the end of April.
However, though the U.S. dollar has recently rallied, it still remains in a bear market. If the U.S. dollar turns back down again, European goods will continue to climb in price, but if the dollar continues to rally, crude oil prices will peak and turn down.
French President Emmanuel Macron was in Washington at the end of April to discuss with President Trump, principally, the Iranian nuclear deal.
Macron was leading an effort by France, Britain, and Germany to find a fix in hopes of persuading the President not to abandon the Iranian nuclear agreement.
The EU is getting cheap Iranian oil and Europe would like that to continue. President Trump wants to stop enriching Iran and Russia and to import U.S. oil to Europe.
Therefore, President Trump wants Iran to not only submit to nuclear inspections, but to stop its ballistic missile program. However, what the U.S. wants most of all is to stop the “sunset” provision in the current Iranian deal that Obama allowed that gives the nuclear bomb to Iran in a few years.
(***oil wars...currency wars...trade wars...war wars...
As we now know, [color=red]Trump has backed out of the deal
Oil surged in April over concerns that should Trump tear up the Iranian Nuclear deal, as many as 1 million barrels of Iranian exports would be eliminated from the market as a result of a return to trade sanctions.
Remember, Iran, Russia, and China are bypassing the U.S. dollar to trade in oil in the petroyuan, sidestepping the petrodollar.[/color] The U.S. is determined to fight back. ...WAR???
We are in an economic war and I figure because Iran, Russia, and China have ditched the petrodollar, President Trump will look to strike a new deal with more solid foundations.
In a stern warning to Iran, President Trump said that if Iran ever threatens the United States, “they will pay a price like few countries have ever paid.”
Thousands of U.S. troops and marines have recently arrived in Jordan, near Syria.
Higher gasoline prices are now hurting the consumer. It drains capital from the economy at a time when the Fed is draining capital from the banking system. That’s a dangerous combination.
...suggests that.....the U.S. wants the U.S. dollar to rally now to bring down oil prices to cut into the income streams of Iran, Russia, and China.
***************************************************************
I said yesterday I thought the FED could slow down the rate hikes and no third hike this year...well maybe the FED best slow down it's balance sheet tapering...to take it up to $40-50 billion a month...that's insane for the Markets. (...the other side of the INSANE coin had the FED pumping $85 Billion a month into the Markets to save us...I mean save the BankerCrooks...and the WallStreet casino...
And I said I wasn't worried until Sept/Oct...well maybe I should start to worry a little sooner.
I got some silver today...not a lot but some...
Enjoy...roller coaster ride...
Join the InvestorsHub Community
Register for free to join our community of investors and share your ideas. You will also get access to streaming quotes, interactive charts, trades, portfolio, live options flow and more tools.

