Correlation Suggests This Financial Group Is About To Explode Higher, Get In Early By: Tom Bowley | May 17, 2018
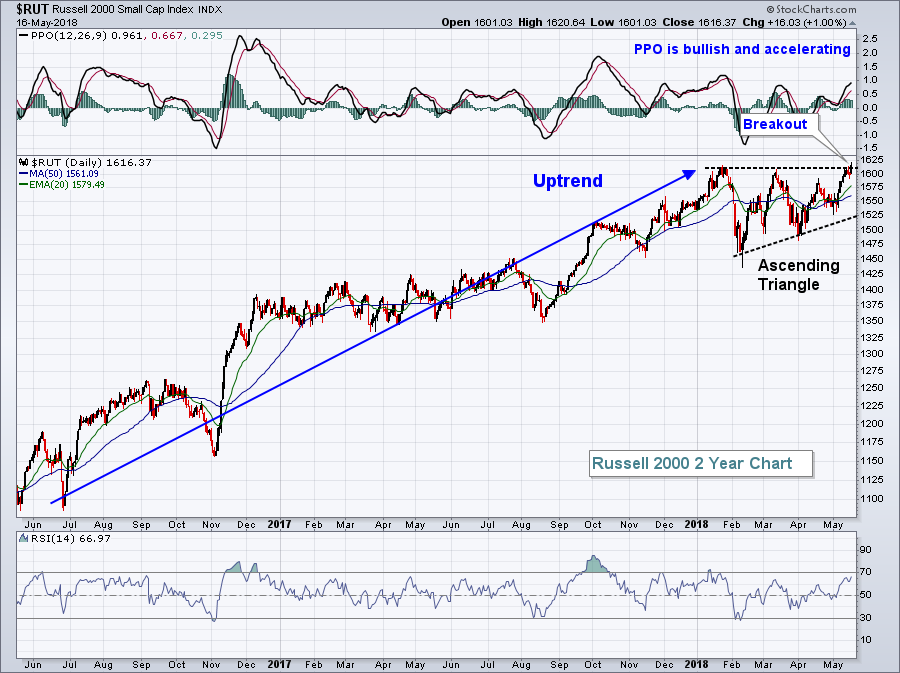
We saw another advance on Wall Street on Wednesday as key indices continue to clear important hurdles. Perhaps the most significant yesterday was the Russell 2000, which ended its bullish continuation pattern as expected - with a bullish breakout to the upside:
It's never a bad thing to see the more aggressive small caps leading the market to the upside and having a pattern measurement only aids the bulls in terms of targets down the road. From top to bottom in this ascending triangle pattern, it measures 175 points. Add that to the breakout level of 1610 and we come up with an initial target of 1785. That provides us with a potentially exciting summer advance.
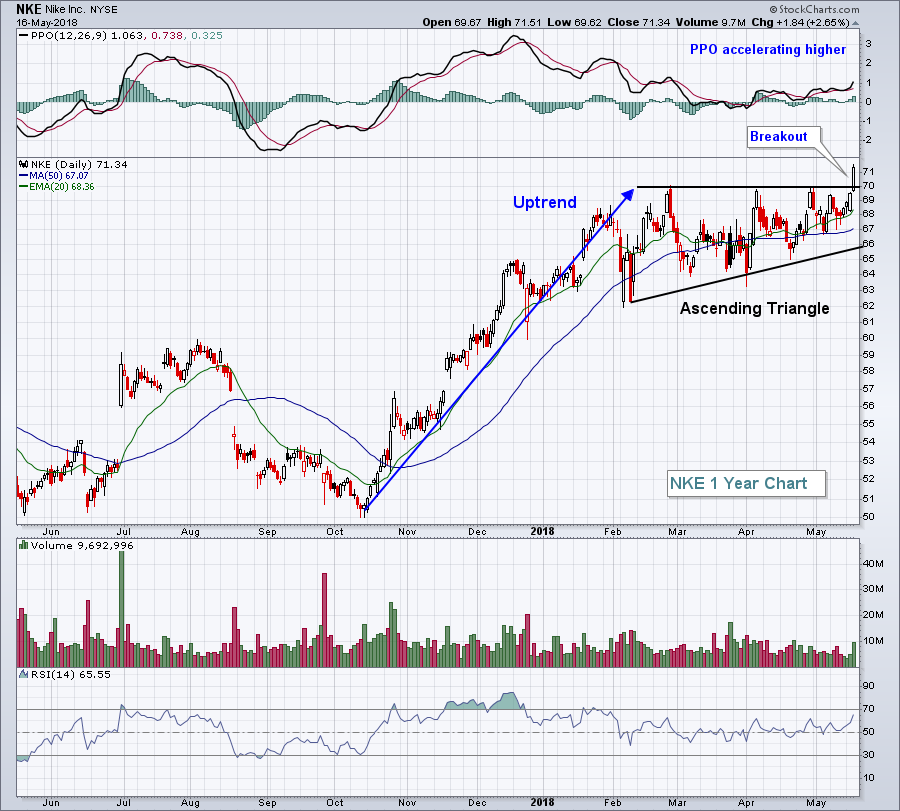
It wasn't just about small caps yesterday, though. One of the Dow Jones components - Nike (NKE) - helped to lead a very strong footwear group ($DJUSFT) with a breakout of its own:
If there was one downside to NKE's performance, it's that volume could've been a bit heavier. It definitely picked up and was the heaviest of the past few weeks, but it wasn't off-the-chart type volume. Still, NKE looks very bullish to me.
The DJUSFT helped to pace the consumer discretionary stocks (XLY, +0.83%) to a second place finish on the sector leaderboard. Materials (XLB, +1.19%) were very strong despite the U.S. Dollar Index ($USD) closing at its highest level of 2018.
Pre-Market Action
Crude oil prices ($WTIC) have crept above $72 per barrel this morning and it'll be very interesting to see if this results in a breakout of the XLE (see Sector/Industry Watch section below). Asian markets were mixed overnight and Europe is higher this morning.
With 30 minutes left to today's opening bell, Dow Jones futures are lower by 33 points.
Current Outlook
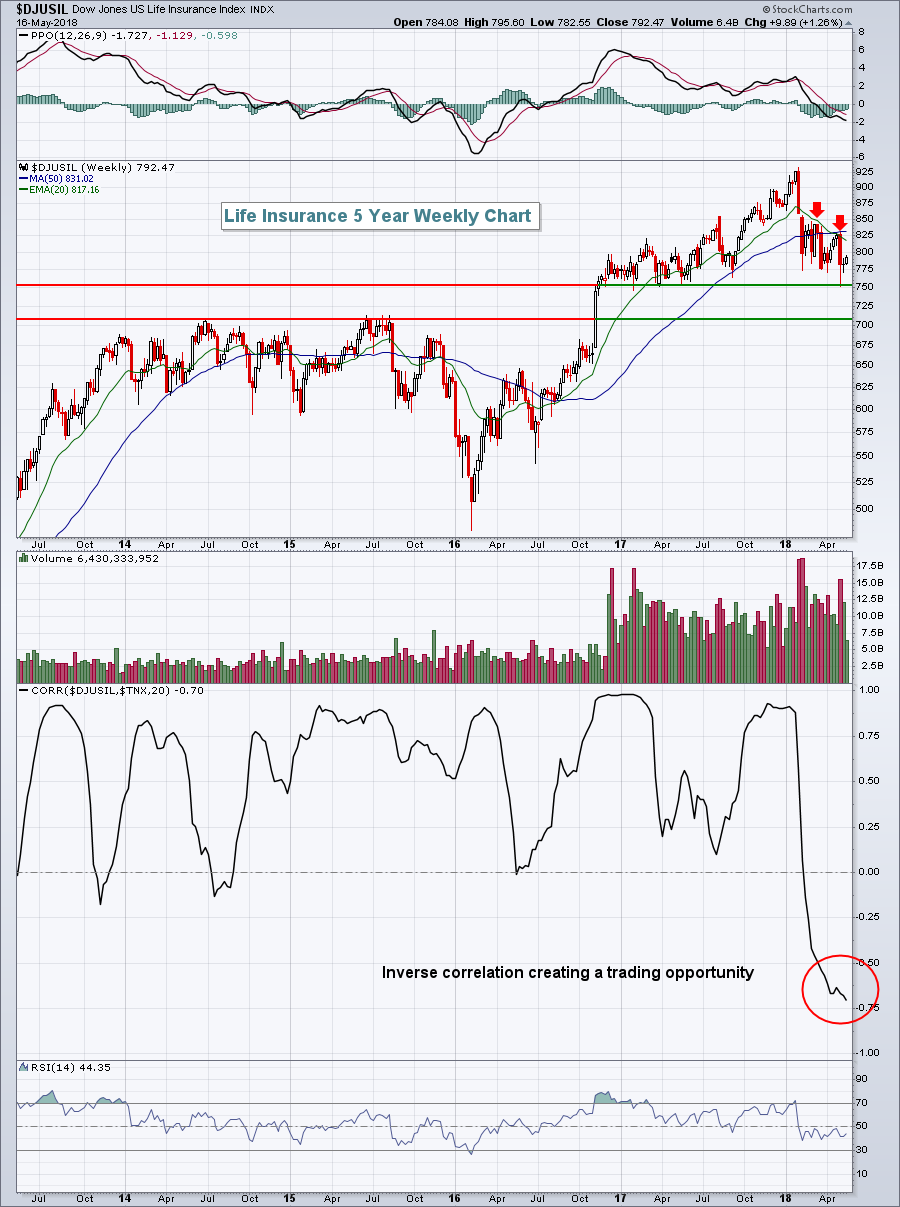
I have a very interesting theme to watch over the next several weeks. The 10 year treasury yield ($TNX) has been on the rise, breaking out to 7 year highs. There's been a strong correlation between the direction of the TNX and the direction of the Dow Jones U.S. Life Insurance Index ($DJUSIL):
There's definitely a positive correlation that exists between treasury yields and the performance of life insurance stocks as correlation typically resides above 0. But that correlation has turned negative and that means one of two things is likely to occur over the next several weeks. Either we'll see the TNX correct lower to mirror the direction of the DJUSIL.....or we'll see life insurance stocks rapidly recover to move more in step with the TNX. I'm betting on the latter.
Information posted to this board is not meant to suggest any specific action, but to point out the technical signs that can help our readers make their own specific decisions. Your Due Dilegence is a must! • DiscoverGold
Register for free to join our community of investors and share your ideas. You will also get access to streaming quotes, interactive charts, trades, portfolio, live options flow and more tools.


 News
News  Market Data
  Discover