


| Followers | 689 |
| Posts | 143817 |
| Boards Moderated | 35 |
| Alias Born | 03/10/2004 |
Wednesday, May 16, 2018 9:18:16 AM
Volatility Signal Not Seen Since 2009
By: Schaeffer's Investment Research | May 16, 2018
How the S&P fares after a volatile start to the year
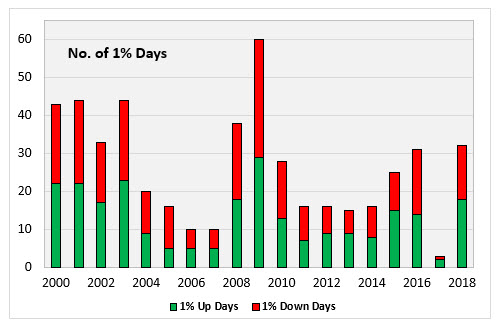
The S&P 500 has made more 1% moves already this year than in all of 2016
At this time last year, there had been only three days in which the S&P 500 Index (SPX) moved by at least 1%. That's absurdly low. This year is quite a bit different, as the number of 1% days has spiked to 32. That's only one more day than we saw in all of 2016, but it’s the highest number since 2009. This week, I’m looking at how this year compares historically -- and whether we can gain any insight into what it means for stocks the rest of the year.
MORE 1% MOVES THAN USUAL BY MID-MAY
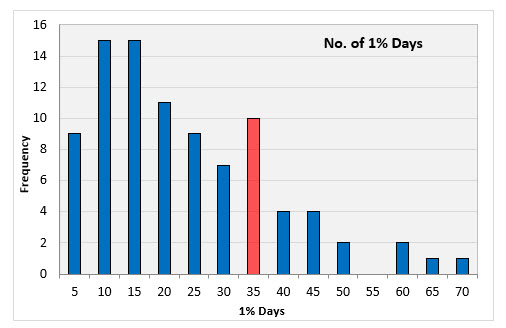
Here’s a histogram of S&P 500 data since 1929 to give us an idea about how many 1% days we should expect by mid-May. The red-colored bar indicates where this year falls. The average number of days is 21, with the median being 17. So, this year’s total of 32 one-day moves of 1% is well above average.
STOCKS ARE UNDERPERFORMING IN 2018
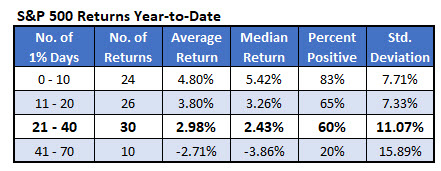
Stocks are typically more volatile going down than going up. The data in the table below, therefore, is not a surprise. It shows the performance of the S&P 500 through mid-May based on the number of days in which the market moved up or down by at least 1%.
During years with fewer than 10 1% days, the index averaged a 4.80% return, with 83% of the days positive. When there were more than 40 days with 1% moves by mid-May, the average return was a loss of 2.71%, and only 20% of the returns were positive. Since there have been 32 days of 1% moves so far this year, that puts us squarely in the third bracket. The S&P 500 is up a little more than 1% year-to-date, so stocks are underperforming some this year, even considering the high number of 1% days.
WHERE DO WE GO FROM HERE?
More importantly, though, is where do we go from here? The table below shows how the S&P 500 has done for the rest of the year based on the number of 1% days. Three of the four brackets look very similar if you focus on the average return and percent positive. The outlier bracket, oddly enough, is that third bracket when there’s between 21 and 40 days of 1% moves -- the bracket that we find ourselves in now.
This bracket shows an average return of just 0.25%, with 55% of the returns positive. The other three brackets all average between 5.31% and 6.31% S&P returns, with 70%-73% of the returns positive.
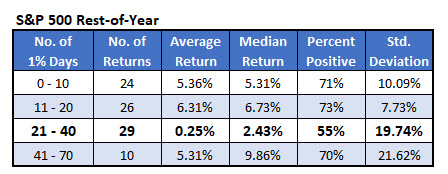
Simple randomness is the most likely explanation on why that third bracket underperforms, rather than there being some sort of anti-sweet spot for the number of 1% days at this point in the year. However, let’s break down those 29 returns a little further and see what happens
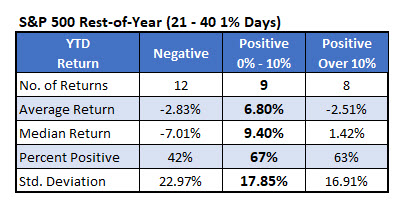
REST-OF-YEAR RETURNS BASED ON YEAR-TO-DATE PERFORMANCE
First, I broke down the returns by the year-to-date return so far. Earlier, I mentioned the S&P 500 was positive by a little over 1%, and that puts us in that middle bracket. Interestingly, when stocks have been negative in this situation, then the rest of the year averages a loss of 2.83%, and when they have gained by more than 10% at this point in the year, they average a loss for the rest of the year of 2.51%. Years in which the index is up moderately with between 21 and 40 days of 1% moves, like this year, the S&P 500 averages a 6.8% return for the rest of the year, with 67% of the returns positive.
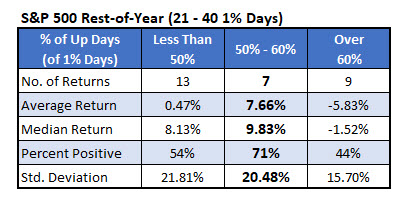
SPX RETURNS BASED ON BIG UP DAYS
Here’s one more way I broke it down. I found that of the 32 days in which the S&P 500 moved 1% this year, 18 of them were positive, or 56%. Look at what happens when I find the rest-of-year returns based on this.
Again, we find ourselves right in a sweet spot. A good sweet spot, not an anti-sweet spot. When fewer than half of the 1% days are up days, the index averages a slight loss for the rest of the year. When more than 60% of the days were up days, then the index has performed awfully the rest of the year, losing 5.83%, on average.
However, when more than half but less than 60% of the days are up days, the rest-of-year returns have been rather good, with the SPX averaging a gain of 7.66% with 71% of the returns positive. So, if you were alarmed by the anti-sweet-spot data above, hopefully the last two tables calmed your fears some.
The high number of 1% days so far this year is interesting and tells us a little about the current environment. The rest-of-year data based on this, though, I would take with a grain of salt. I’m inclined to chalk it up to randomness. That’s a much more likely explanation than suggesting anti-sweet spots and sweet spots.
https://www.schaeffersresearch.com/content/analysis/2018/05/16/volatility-signal-not-seen-since-2009
• DiscoverGold
By: Schaeffer's Investment Research | May 16, 2018
How the S&P fares after a volatile start to the year
The S&P 500 has made more 1% moves already this year than in all of 2016
At this time last year, there had been only three days in which the S&P 500 Index (SPX) moved by at least 1%. That's absurdly low. This year is quite a bit different, as the number of 1% days has spiked to 32. That's only one more day than we saw in all of 2016, but it’s the highest number since 2009. This week, I’m looking at how this year compares historically -- and whether we can gain any insight into what it means for stocks the rest of the year.

MORE 1% MOVES THAN USUAL BY MID-MAY
Here’s a histogram of S&P 500 data since 1929 to give us an idea about how many 1% days we should expect by mid-May. The red-colored bar indicates where this year falls. The average number of days is 21, with the median being 17. So, this year’s total of 32 one-day moves of 1% is well above average.

STOCKS ARE UNDERPERFORMING IN 2018
Stocks are typically more volatile going down than going up. The data in the table below, therefore, is not a surprise. It shows the performance of the S&P 500 through mid-May based on the number of days in which the market moved up or down by at least 1%.
During years with fewer than 10 1% days, the index averaged a 4.80% return, with 83% of the days positive. When there were more than 40 days with 1% moves by mid-May, the average return was a loss of 2.71%, and only 20% of the returns were positive. Since there have been 32 days of 1% moves so far this year, that puts us squarely in the third bracket. The S&P 500 is up a little more than 1% year-to-date, so stocks are underperforming some this year, even considering the high number of 1% days.

WHERE DO WE GO FROM HERE?
More importantly, though, is where do we go from here? The table below shows how the S&P 500 has done for the rest of the year based on the number of 1% days. Three of the four brackets look very similar if you focus on the average return and percent positive. The outlier bracket, oddly enough, is that third bracket when there’s between 21 and 40 days of 1% moves -- the bracket that we find ourselves in now.
This bracket shows an average return of just 0.25%, with 55% of the returns positive. The other three brackets all average between 5.31% and 6.31% S&P returns, with 70%-73% of the returns positive.

Simple randomness is the most likely explanation on why that third bracket underperforms, rather than there being some sort of anti-sweet spot for the number of 1% days at this point in the year. However, let’s break down those 29 returns a little further and see what happens
REST-OF-YEAR RETURNS BASED ON YEAR-TO-DATE PERFORMANCE
First, I broke down the returns by the year-to-date return so far. Earlier, I mentioned the S&P 500 was positive by a little over 1%, and that puts us in that middle bracket. Interestingly, when stocks have been negative in this situation, then the rest of the year averages a loss of 2.83%, and when they have gained by more than 10% at this point in the year, they average a loss for the rest of the year of 2.51%. Years in which the index is up moderately with between 21 and 40 days of 1% moves, like this year, the S&P 500 averages a 6.8% return for the rest of the year, with 67% of the returns positive.

SPX RETURNS BASED ON BIG UP DAYS
Here’s one more way I broke it down. I found that of the 32 days in which the S&P 500 moved 1% this year, 18 of them were positive, or 56%. Look at what happens when I find the rest-of-year returns based on this.
Again, we find ourselves right in a sweet spot. A good sweet spot, not an anti-sweet spot. When fewer than half of the 1% days are up days, the index averages a slight loss for the rest of the year. When more than 60% of the days were up days, then the index has performed awfully the rest of the year, losing 5.83%, on average.
However, when more than half but less than 60% of the days are up days, the rest-of-year returns have been rather good, with the SPX averaging a gain of 7.66% with 71% of the returns positive. So, if you were alarmed by the anti-sweet-spot data above, hopefully the last two tables calmed your fears some.

The high number of 1% days so far this year is interesting and tells us a little about the current environment. The rest-of-year data based on this, though, I would take with a grain of salt. I’m inclined to chalk it up to randomness. That’s a much more likely explanation than suggesting anti-sweet spots and sweet spots.
https://www.schaeffersresearch.com/content/analysis/2018/05/16/volatility-signal-not-seen-since-2009
• DiscoverGold
Information posted to this board is not meant to suggest any specific action, but to point out the technical signs that can help our readers make their own specific decisions. Your Due Dilegence is a must!
• DiscoverGold
Join the InvestorsHub Community
Register for free to join our community of investors and share your ideas. You will also get access to streaming quotes, interactive charts, trades, portfolio, live options flow and more tools.

