


| Followers | 689 |
| Posts | 143817 |
| Boards Moderated | 35 |
| Alias Born | 03/10/2004 |
Tuesday, April 24, 2018 11:29:46 AM
Treasury Breakdown Horror Scenario...
By: Clive Maund | April 24, 2018
For a long time we have heard lofty talk from the Fed about “normalizing interest rates”. What they mean by normalizing interest rates and the impression they try to create by using this term are very different, however. What they mean is raising them by 1 or 2 percent maximum, what the markets think they mean is a return to normal times when they would have risen by say 5%. Given the current horrendous debt structure, not only is a return to a 5% or so rise out of the question, so is a rise of a much more modest 2%. But talk is cheap, and the reason for all these grandiose enunciations about a program of rate hikes has been to provide cover to enable the further massive increases in debt that we have seen over the past year or so, without crashing the dollar or Treasury market, and to give the Fed an opportunity to start offloading its toxic burden of Treasuries that it accumulated because there was a shortfall of buyers of this garbage. Another factor weighing on Treasuries is that China at last seems to have seen the light and stopped buying them – after all it’s hard to imagine anything more dumb than buying the paper of a country that plans to overpower you militarily.
What we are about to see now though is the market call the Fed’s bluff. Treasuries are selling off to the extent that they are about to break down into a bearmarket, and yields are rising ominously. In addition there is a dangerous narrowing of yields between the short and the long end which has reached the point where long-dated Treasuries will soon be dumped as there is no incentive to hold them. Needless to say, should this occur, it will cause rates to spike and crash the stockmarket. If this scenario comes to pass, as looks quite likely, Trump’s many Deep State enemies will be rubbing their hands with glee, as a buoyant stockmarket has been one of the few things he has had to boast about.
A possible scenario is this – the differential between short and long bond yields continues to narrow or even vanish or invert, the long bonds especially then plunge, rates spike, the stockmarket crashes, discrediting Trump. Then the Fed does a u-turn on its rate rise program, aborting it, and reverting to vigorous QE which will lead to hyperinflation. This is the point at which commodities soar, especially gold and silver.
We will now look at this perilous situation on the charts for an important long bond proxy, the iShares 20+ Year plus Treasury Bond ETF, TLT.
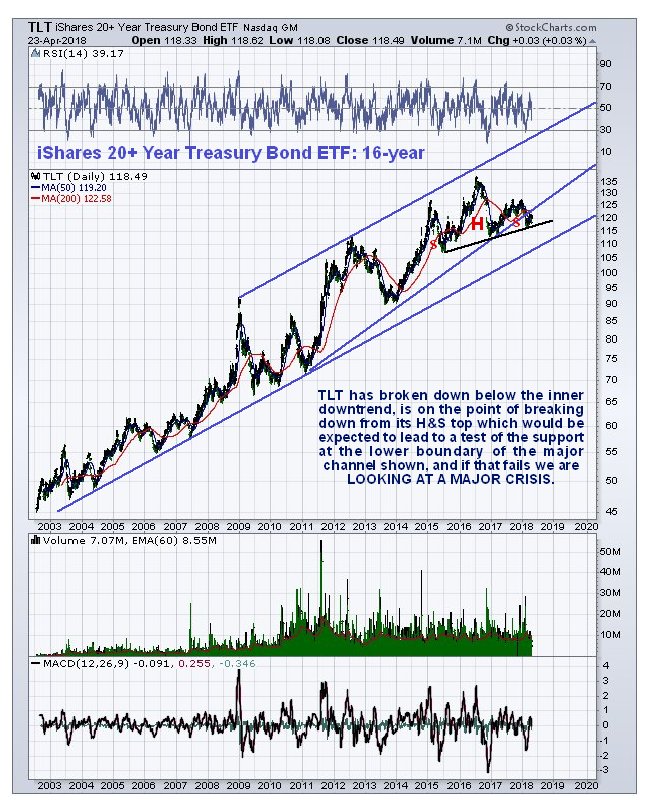
On its long-term 16-year chart we can see that TLT has been in a steady bullmarket since at least 2002, hardly surprising given that rates dropped to almost zero not very long ago, but since it is a known fact that rates can’t drop much below zero, it cannot squeeze any more upside from this source. Thus it is interesting to observe that since early 2015 a large Head-and-Shoulders top appears to have been forming, and if it breaks down from this and drops hard, it is clear that rates will spike significantly, and markets, now severely burdened with debt, will implode.
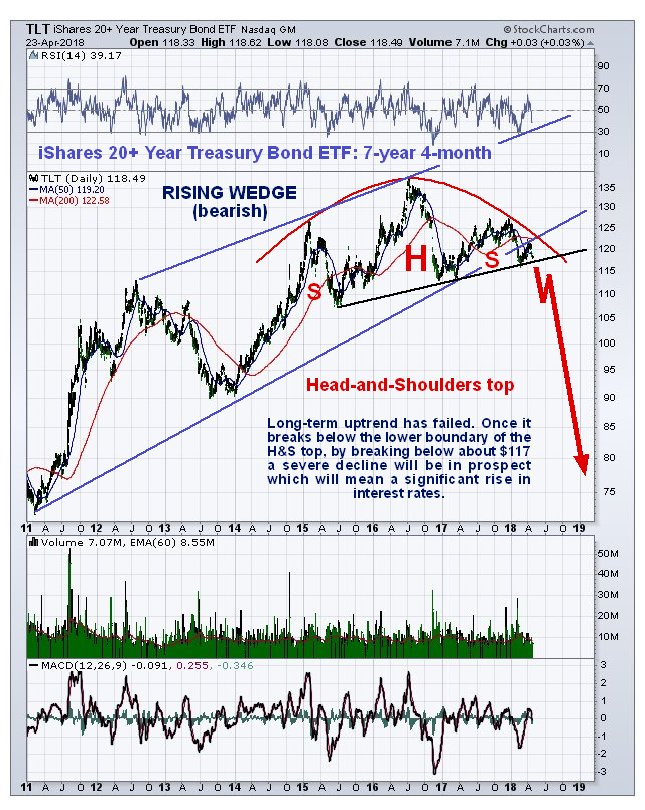
On the 7-year chart we can see the upsloping Head-and-Shoulders top in TLT in detail and that it is perilously close to breaking down below the neckline of the pattern. If this happens it can be expected to quite quickly slice through the key long-term uptrend line shown on the 16-year chart and plunge, which will of course synchronize with a big spike in interest rates, whereupon all hell will break loose across markets, as a myriad of Ponzi schemes founded on cheap rates collapse. After a suitable degree of mayhem, the Fed will reverse course into the final act of the grand fiat experiment, QE into terminal hyperinflation, whereupon we would do well to study up on what happened to Zimbabwe and Venezuela, after buying up our gold and silver investments well in advance.
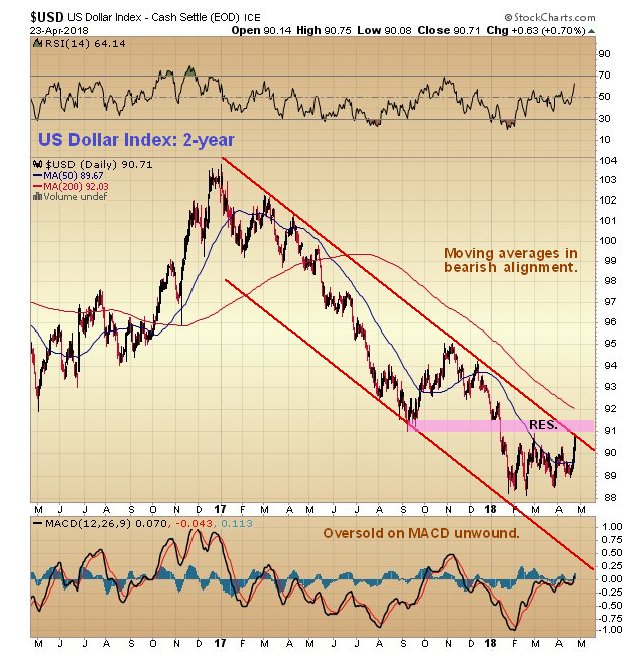
The dollar’s latest 2-year chart is shown, and we will be looking at it in more detail later, including the implications of the latest Hedgers’ positions.
https://www.clivemaund.com/free.php?id=4646
• DiscoverGold
By: Clive Maund | April 24, 2018
For a long time we have heard lofty talk from the Fed about “normalizing interest rates”. What they mean by normalizing interest rates and the impression they try to create by using this term are very different, however. What they mean is raising them by 1 or 2 percent maximum, what the markets think they mean is a return to normal times when they would have risen by say 5%. Given the current horrendous debt structure, not only is a return to a 5% or so rise out of the question, so is a rise of a much more modest 2%. But talk is cheap, and the reason for all these grandiose enunciations about a program of rate hikes has been to provide cover to enable the further massive increases in debt that we have seen over the past year or so, without crashing the dollar or Treasury market, and to give the Fed an opportunity to start offloading its toxic burden of Treasuries that it accumulated because there was a shortfall of buyers of this garbage. Another factor weighing on Treasuries is that China at last seems to have seen the light and stopped buying them – after all it’s hard to imagine anything more dumb than buying the paper of a country that plans to overpower you militarily.
What we are about to see now though is the market call the Fed’s bluff. Treasuries are selling off to the extent that they are about to break down into a bearmarket, and yields are rising ominously. In addition there is a dangerous narrowing of yields between the short and the long end which has reached the point where long-dated Treasuries will soon be dumped as there is no incentive to hold them. Needless to say, should this occur, it will cause rates to spike and crash the stockmarket. If this scenario comes to pass, as looks quite likely, Trump’s many Deep State enemies will be rubbing their hands with glee, as a buoyant stockmarket has been one of the few things he has had to boast about.
A possible scenario is this – the differential between short and long bond yields continues to narrow or even vanish or invert, the long bonds especially then plunge, rates spike, the stockmarket crashes, discrediting Trump. Then the Fed does a u-turn on its rate rise program, aborting it, and reverting to vigorous QE which will lead to hyperinflation. This is the point at which commodities soar, especially gold and silver.
We will now look at this perilous situation on the charts for an important long bond proxy, the iShares 20+ Year plus Treasury Bond ETF, TLT.
On its long-term 16-year chart we can see that TLT has been in a steady bullmarket since at least 2002, hardly surprising given that rates dropped to almost zero not very long ago, but since it is a known fact that rates can’t drop much below zero, it cannot squeeze any more upside from this source. Thus it is interesting to observe that since early 2015 a large Head-and-Shoulders top appears to have been forming, and if it breaks down from this and drops hard, it is clear that rates will spike significantly, and markets, now severely burdened with debt, will implode.

On the 7-year chart we can see the upsloping Head-and-Shoulders top in TLT in detail and that it is perilously close to breaking down below the neckline of the pattern. If this happens it can be expected to quite quickly slice through the key long-term uptrend line shown on the 16-year chart and plunge, which will of course synchronize with a big spike in interest rates, whereupon all hell will break loose across markets, as a myriad of Ponzi schemes founded on cheap rates collapse. After a suitable degree of mayhem, the Fed will reverse course into the final act of the grand fiat experiment, QE into terminal hyperinflation, whereupon we would do well to study up on what happened to Zimbabwe and Venezuela, after buying up our gold and silver investments well in advance.

The dollar’s latest 2-year chart is shown, and we will be looking at it in more detail later, including the implications of the latest Hedgers’ positions.

https://www.clivemaund.com/free.php?id=4646
• DiscoverGold
Information posted to this board is not meant to suggest any specific action, but to point out the technical signs that can help our readers make their own specific decisions. Your Due Dilegence is a must!
• DiscoverGold
Join the InvestorsHub Community
Register for free to join our community of investors and share your ideas. You will also get access to streaming quotes, interactive charts, trades, portfolio, live options flow and more tools.

