Three Strike Trend Following with the PPO By: Arthur Hill | April 21, 2018
The Percentage Price Oscillator (PPO) is mostly used as a momentum oscillator, but chartists can also use it to define the trend, even the long-term trend. Chartists interested in trend signals can simply ignore the wiggles and the signal line, and instead focus on zero line crossovers.
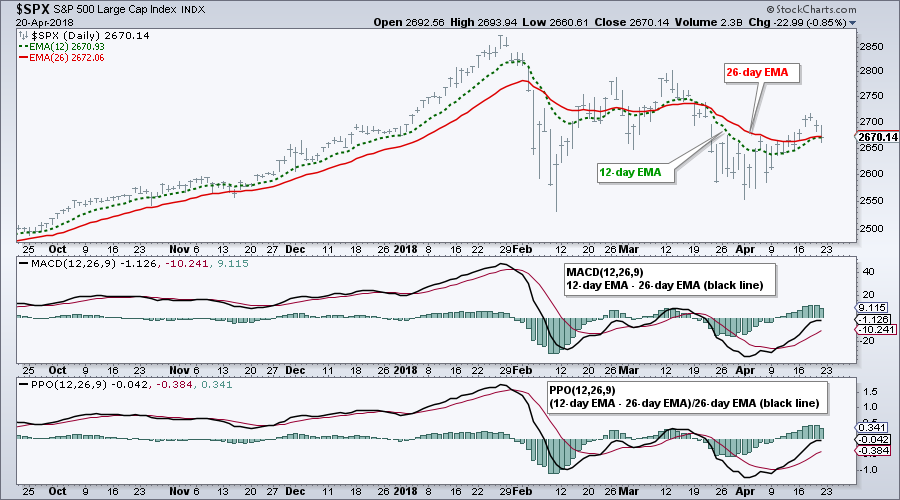
As noted in ChartSchool, the PPO is the percentage version of MACD because it measures the difference between two EMAs. The PPO takes MACD a step further by dividing this difference by the longer EMA. MACD shows the absolute difference, while the PPO shows the difference as a percentage of the longer EMA.
The chart below shows MACD and the PPO with the classic settings. Both are positive when the shorter EMA is above the longer EMA and negative when the shorter EMA is below the longer EMA. The PPO values show, in percent terms, how far the shorter EMA is above or below the longer EMA.
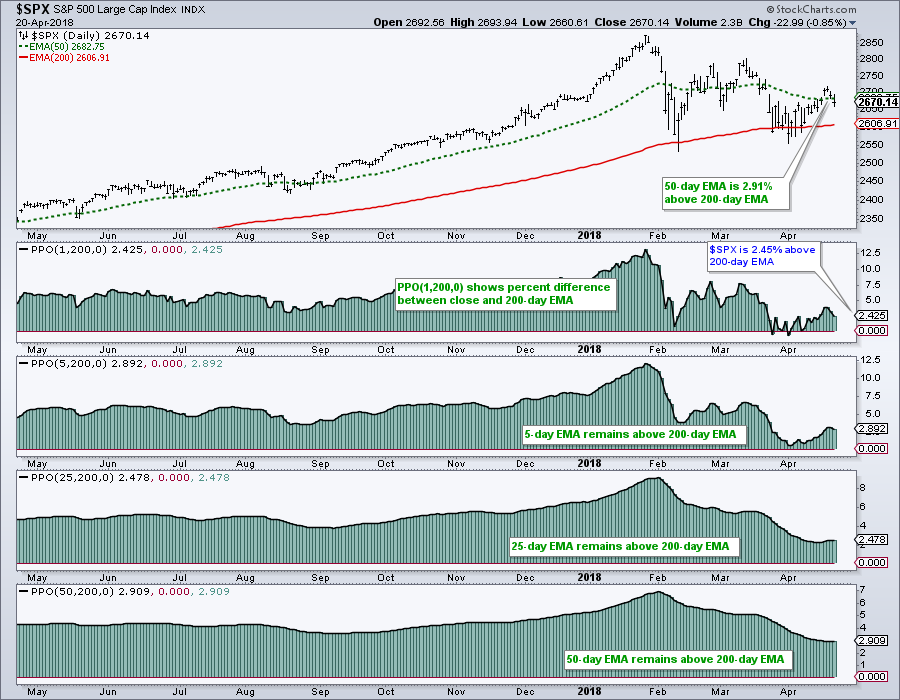
Now let's use some longer EMAs to turn the PPO into a trend following indicator. The chart below shows the S&P 500 with the 50-day EMA, 200-day EMA and four PPOs. The first, PPO(1,200,0), shows the difference between a 1-day EMA, which equals the close, and the 200-day EMA. The last parameter (0) is the signal line. Setting this to zero will show the PPO as a histogram.
I would suggest ignoring the PPO(1,200,0) because it produces a lot of whipsaws (false signals). At least smooth the close with a 5-day EMA. Hence, the last three PPOs reflect the difference between three key EMA pairs: 5-day/200-day, 25-day/200-day and 50-day/200-day.
Chartists interested in the big trend can use these PPOs to count strikes for the bears.
Strike one would occur when the PPO(5,200,0) turns negative, strike two would hit when the PPO(25,200,0) turns negative and strike three would be called with the death cross (50-day EMA moving below 200-day EMA). Note that the bears have yet to throw a strike and the bulls still control the long-term trend.
For those keeping score at home, the 5-day EMA has crossed the 200-day EMA forty-five times since 1990. In addition, the 5-day has been above the 200-day EMA for 72% of the time during this timeframe. Investors buying on a bullish cross and selling on a bearish cross would have earned around 7.2% per year (excluding dividends).
Information posted to this board is not meant to suggest any specific action, but to point out the technical signs that can help our readers make their own specific decisions. Your Due Dilegence is a must! • DiscoverGold
Register for free to join our community of investors and share your ideas. You will also get access to streaming quotes, interactive charts, trades, portfolio, live options flow and more tools.


 News
News  Market Data
  Discover