DP (SPY) Weekly Wrap: Technology Whipsaw By: Carl Swenlin | April 20, 2018
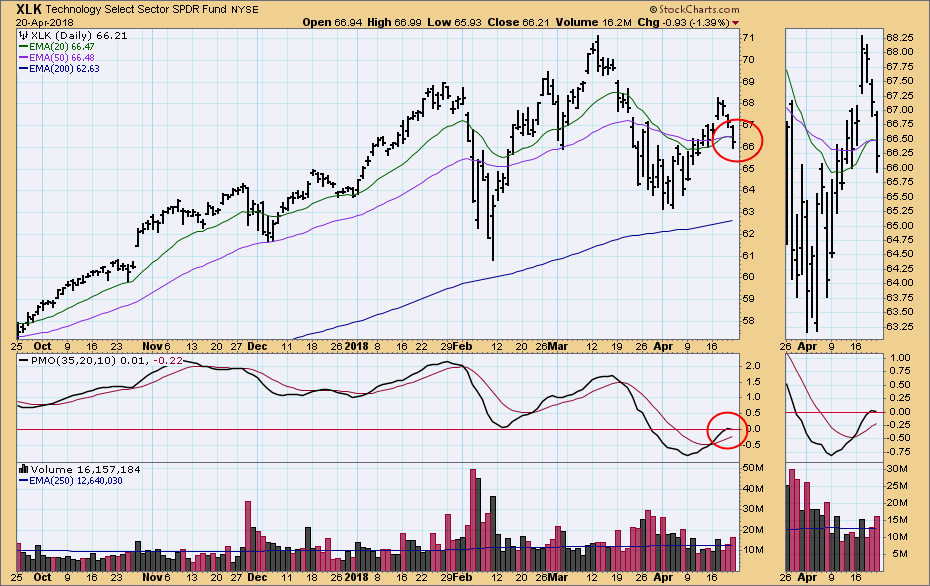
The technology sector (XLK) switched from NEUTRAL to BUY on Thursday, but reversed from BUY to NEUTRAL on Friday. The problem is that recent sideways price movement has squeezed the 20EMA and 50EMA very close together, and price movement above or below the EMAs can cause whipsaw signals. To review, our Intermediate-Term Trend Model (ITTM) changes to BUY when the 20EMA crosses up through the 50EMA. The signal changes to NEUTRAL when a 20/50EMA downside crossover takes place above the 200EMA. If XLK rallies above the EMAs on Monday, a new BUY signal will be generated; however, the daily PMO has topped, leading me to believe that the decline will continue.
SECTORS
Each S&P 500 Index component stock is assigned to one, and only one, of 10 major sectors. This is a snapshot of the Intermediate-Term and Long-Term Trend Model signal status for those sectors.
STOCKS
IT Trend Model: NEUTRAL as of 3/23/2018
LT Trend Model: BUY as of 4/1/2016
SPY Daily Chart: Notice that this month's rally failed before it reached the top of the triangle formation, and the daily PMO is getting ready to top. Volume faded into the rally, but it was stronger on Thursday and Friday. This almost certainly has to do with options expiration this week.
SPY Weekly Chart: This week's price bar looks like a top, and the weekly PMO is still falling. The cyclical bull market rising trend line remains intact, but I think it will be challenged again soon.
Short-Term Market Indicators: The STO-B (breadth) and STO-V (volume) topped this week after becoming overbought.
Intermediate-Term Market Indicators: The ITBM and ITVM had become somewhat overbought, and they topped on Friday. There are some pretty profound reverse divergences in place, which is actually a positive sign -- a lower indicator low versus a higher price low shows that price is resisting an internal blowout.
Conclusion: I continue to believe that we are in a bear market. We still need to see a 50EMA/200EMA downside crossover (death cross) to make it official, but the parabolic rise into January caused extreme separation between the EMAs, and that kind of broke the long-term model temporarily. Short-term and intermediate-term indicators have topped and they will accommodate a substantial decline before they become oversold. Obviously, I can't know what the future holds, but it looks to me as if the market is poised to retest this year's lows...
Click on "In reply to", for Authors past commentaries
Information posted to this board is not meant to suggest any specific action, but to point out the technical signs that can help our readers make their own specific decisions. Your Due Dilegence is a must! • DiscoverGold
Register for free to join our community of investors and share your ideas. You will also get access to streaming quotes, interactive charts, trades, portfolio, live options flow and more tools.


 News
News  Market Data
  Discover