


| Followers | 689 |
| Posts | 143817 |
| Boards Moderated | 35 |
| Alias Born | 03/10/2004 |
Saturday, April 21, 2018 8:33:17 AM
CoT: Peek Into Future Through Futures, How Hedge Funds Are Positioned
By: Hedgopia | April 21, 2018
Following futures positions of non-commercials are as of April 17, 2018.
E-mini S&P 500: Currently net long 212.3k, up 2.7k.
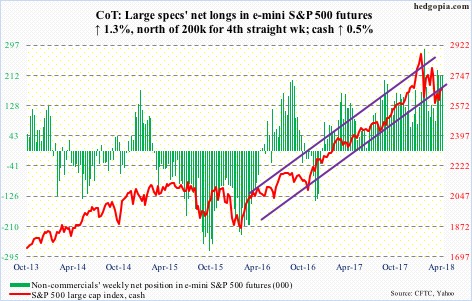
The cash (2670.14), having rallied to 2717.49 Thursday, came very close to testing a falling trend line from January 26 when it peaked at 2872.87. It was an unsuccessful test. If the daily chart prevails, it will remain that way. At least near term, the path of least resistance is down. The week produced a gravestone doji.
If this scenario pans out, it will be interesting to see how flows respond. In the week to Wednesday, US-based equity funds (including ETFs) took in $4.6 billion (courtesy of Lipper.com).
In the same week, $309 million moved into SPY (SPDR S&P 500 ETF) and $304 million into VOO (Vanguard S&P 500 ETF), while IVV (iShares core S&P 500 ETF) lost $239 million (courtesy of ETF.com).
In the meantime, foreigners’ 12-month purchases of US stocks peaked in January, as did the S&P 500.
Nasdaq 100 index (mini): Currently net short 7.9k, up 1.2k.
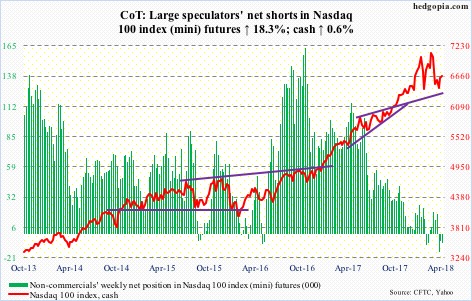
The cash (6667.75) enjoyed a back-to-back positive week, but not before giving out signs of fatigue. Wednesday produced a spinning top, with the session high kissing the daily upper Bollinger band.
In the week ended that session, QQQ (PowerShares QQQ ETF) pulled in another $1.9 billion. In the prior week, $197 million came in (courtesy of ETF.com). All positive, except the Nasdaq 100 may need to digest recent gains.
Friday, it sliced through the 50-day. This also approximates trend-line support from nearly three weeks ago.
Russell 2000 mini-index: Currently net long 15.8k, up 5.1k.
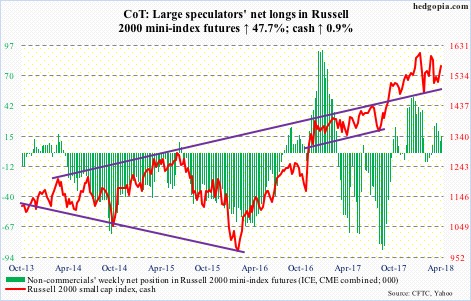
In a shooting star session Wednesday, the cash (1564.12) got rejected at a falling trend line from the all-time high of 1615.52 on January 24. It has had a nice rally since bottoming at 1482.90 on the 2nd this month – with full cooperation from flows in the past couple of weeks.
In the week to Wednesday, $789 million moved into IWM (iShares Russell 2000 ETF) and $417 million into IJR (iShares core S&P small-cap ETF). This was preceded by inflows of $868 million and $248 million, respectively, in the prior week (courtesy of ETF.com).
The daily chart is overbought, and is itching to go lower. The 50-day lies at 1543.09.
US Dollar Index: Currently net short 2.4k, up 610.
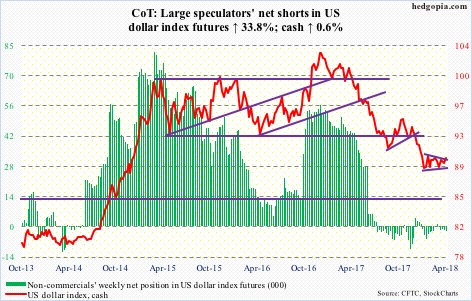
One more week of sideways congestion inside a symmetrical triangle. This more often than not is a continuation pattern. The cash (90.07) has gone sideways the past three months after coming under sustained pressure beginning January 2017.
There is major support at 88-89, which goes back to at least 2004, and this once again held early this week. Friday, the US dollar index rallied past the 50-day – now slightly rising – into the daily upper Bollinger band. Short-term resistance lies at 90.30-ish.
VIX: Currently net long 78k, down 15k.
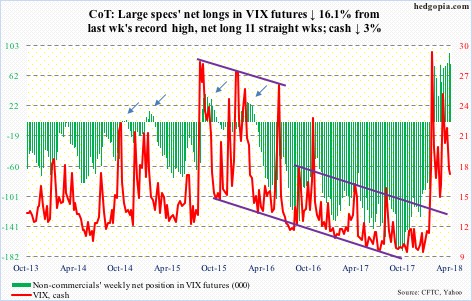
Several weekly momentum indicators on the cash (16.88) have reached the median. This is as good a place as any for volatility bulls to put their foot down.
Tuesday, VIX went sub-15 intraday to test the daily lower Bollinger band before closing above. Support at 15-16 is intact.
There is room for continued unwinding of the daily oversold conditions.
https://hedgopia.com/cot-peek-into-future-through-futures-how-hedge-funds-are-positioned-49/
• DiscoverGold
Click on "In reply to", for Authors past commentaries
Information posted to this board is not meant to suggest any specific action, but to point out the technical signs that can help our readers make their own specific decisions. Your Due Dilegence is a must!
• DiscoverGold
Join the InvestorsHub Community
Register for free to join our community of investors and share your ideas. You will also get access to streaming quotes, interactive charts, trades, portfolio, live options flow and more tools.

