Groups Breadth Leaning Weak By: Bespoke | April 20, 2018
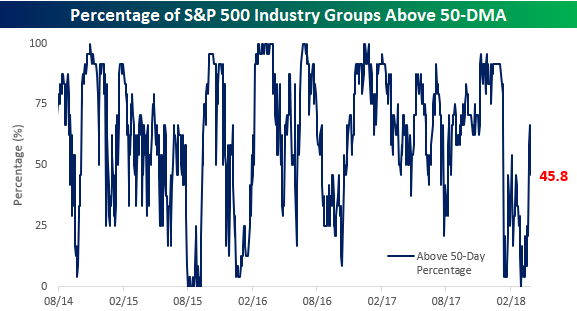
Two days ago, the percentage of S&P 500 Industry Groups trading above their 50-DMAs reached 66.6%, which was a huge improvement from the 0% reading we saw back in late March. Over the last two days, we’ve seen this percentage dip back below 50% just as the S&P 500 did the same today. At the surface, breadth in individual groups appears to be tracking the S&P 500 pretty closely.
Looking a little more closely, though, breadth isn’t as solid as it may seem. The table below shows each of the 24 S&P 500 Industry Groups and how they’ve performed YTD as well as where they are trading relative to their 50-DMAs. Note in this table that although 11 out of 24 Industry Groups are above their 50-DMAs, many of them are hanging on by a thread. For example, three of the Industry Groups (Materials, Div Financials, and Software and Services) are less than 0.1% above their 50-DMAs and another two are less than 1% above that level. In this current market environment, it wouldn’t take much of a decline to send all five of these Industry Groups back below their 50-DMAs. In fact, the only Industry Group that would be immune to a one-day sell-off dragging it below its own 50-DMA is Energy! On the flipside, the only Industry Group currently below its 50-DMA that is within a percent of getting back above that level is Capital Goods (-0.18%). In other words, while it wouldn’t take much of a decline to make this breadth reading look really bad, it would take a pretty sizable rally to make it look good.
In terms of YTD performance, just eight Industry Groups are in the green for the year as of now, while twice that number are down on the year. The biggest losers by far are both from the Consumer Staples sector. The Household and Personal Products group is down a whopping 14.9% on the year already, while Food Beverage & Tobacco stocks are down over 12%. Perhaps the irony of all ironies this year is that the Retailing Group is up 14.6% YTD. Before anyone starts thinking retail stocks are seeing some sort of renaissance, keep in mind that practically all of the gains in the group are the result of Amazon.com (AMZN), which is up 31% YTD and Netflix (NFLX), which is up over 70%. Besides these two big winners, the average YTD performance of stocks in the Retailing group is a decline of over 3%.
Information posted to this board is not meant to suggest any specific action, but to point out the technical signs that can help our readers make their own specific decisions. Your Due Dilegence is a must! • DiscoverGold
Register for free to join our community of investors and share your ideas. You will also get access to streaming quotes, interactive charts, trades, portfolio, live options flow and more tools.


 News
News  Market Data
  Discover