


Thursday, February 15, 2018 10:56:56 PM
Blue Skies Data
Good Morning Ladies and Gentlemen
~Welcome To :
~*~Mining & Metals Du Jour~*~ Graveyard Shift~
Always a Pleasure To Have You With Us
MMgys
and The Forecast Is "Blue Skies"
OK Here We Go >>>>>>>>>>>>>>>>>>
Onwards To The Data
xxxxxxxxxxxxxxxxxxxxxxxxxxxxxxxxxxxxxxxxxxxxxxxxxxxxxxxxxxxx
There Will Be No Economic Boom
Written by Lance Roberts | Feb, 15, 2018

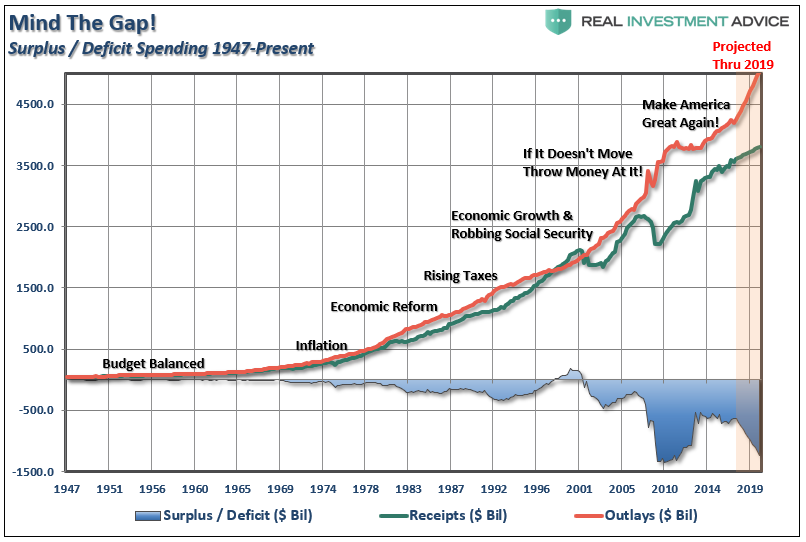
Last week, Congress passed a 2-year “continuing resolution, or C.R.,” to keep the Government funded through the 2018 elections. While “fiscal conservatism” was just placed on the sacrificial alter to satisfy the “Re-election” Gods,” the bigger issue is the impact to the economy and, ultimately, the financial markets.
The passage of the $400 billion C.R. has an impact that few people understand. When a C.R. is passed it keeps Government spending at the same previous baseline PLUS an 8% increase. The recent C.R. just added $200 billion per year to that baseline. This means over the next decade, the C.R. will add $2 Trillion in spending to the Federal budget. Then add to that any other spending approved such as the proposed $200 billion for an infrastructure spending bill, money for DACA/Immigration reform, or a whole host of other social welfare programs that will require additional funding.
But that is only half the problem. The recent passage of tax reform will trim roughly $2 Trillion from revenues over the next decade as well.
This is easy math.
Cut $2 trillion in revenue, add $2 trillion in spending, and you create a $4 trillion dollar gap in the budget. Of course, that is $4 Trillion in addition to the current run rate in spending which continues the current acceleration of the “debt problem.”
But it gets worse.
As Oxford Economics reported via Zerohedge:
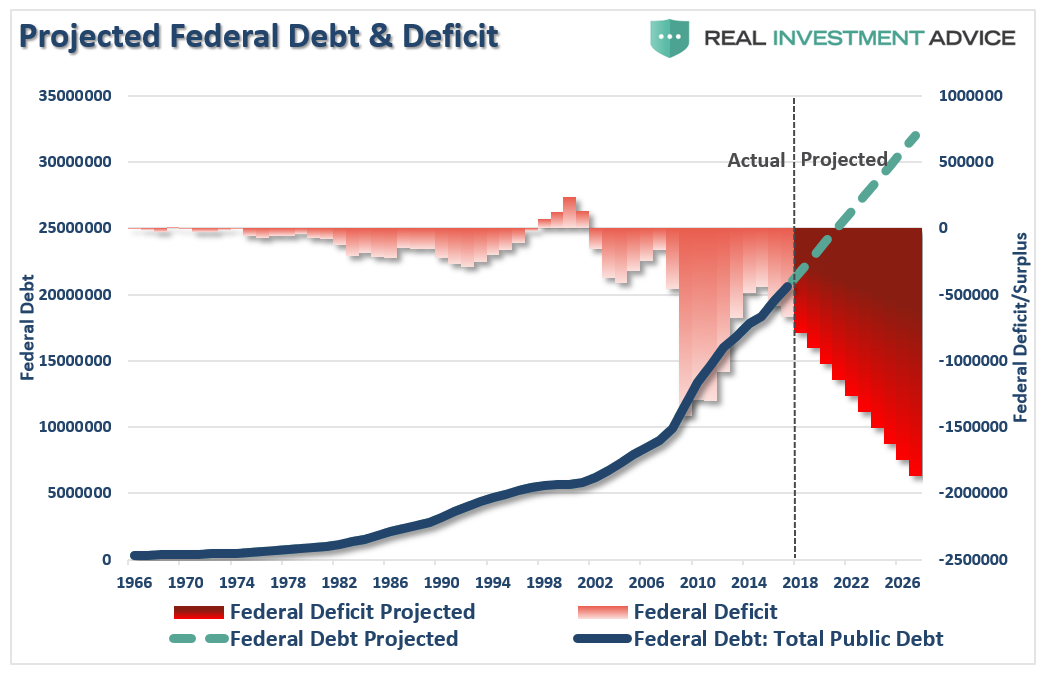
“The tax cuts passed late last year, combined with the spending bill Congress passed last week, will push deficits sharply higher. Furthermore, Trump’s own budget anticipates that US debt will hit $30 trillion by 2028: an increase of $10 trillion.”
Oxford is right. In order to “pay for” all of the proposed spending, at a time when the government will receive less revenue in the form of tax collections, the difference will be funded through debt issuance.
Simon Black recently penned an interesting note on this:
“Less than two weeks ago, the United States Department of Treasury very quietly released its own internal projections for the federal government’s budget deficits over the next several years. And the numbers are pretty gruesome.
In order to plug the gaps from its soaring deficits, the Treasury Department expects to borrow nearly $1 trillion this fiscal year. Then nearly $1.1 trillion next fiscal year. And up to $1.3 trillion the year after that.
This means that the national debt will exceed $25 trillion by September 30, 2020.”
Of course, “fiscal responsibility” left Washington a long time ago, so, what’s another $10 Trillion at this point?
While this issue is not lost on a vast majority of Americans that “choose” to pay attention, it has been quickly dismissed by much of the mainstream media, and Congressman running for re-election, by suggesting tax reform will significantly boost economic growth over the next decade. The general statement has been:
“By passing much-needed tax reform, we will finally unleash the economic growth engine which will more than pay for these tax cuts in the future.”
Don’t dismiss the importance of $25-30 Trillion in U.S. debt. It is larger than the debts of every other nation in the world – combined.
Congress Killed The Economic Boom
While it truly is a great “talking point,” the reality is it just isn’t true.
As I have shown previously, there is absolutely NO historical evidence that cutting taxes, without offsetting cuts to spending, leads to stronger economic growth.
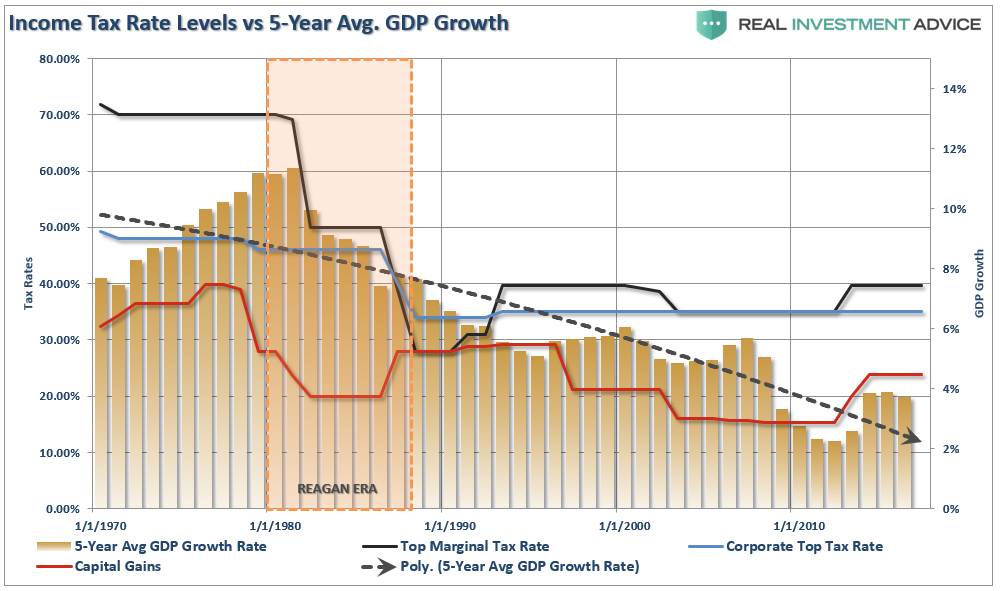
Even Congressman Kevin Brady, Chairman of the House Ways and Means Committee, confirmed the same.
Deficits, and deficit spending, are HIGHLY destructive to economic growth as it directly impacts gross receipts and saved capital equally. Like cancer – running deficits, along with continued deficit spending, continues to destroy saved capital and damages capital formation.
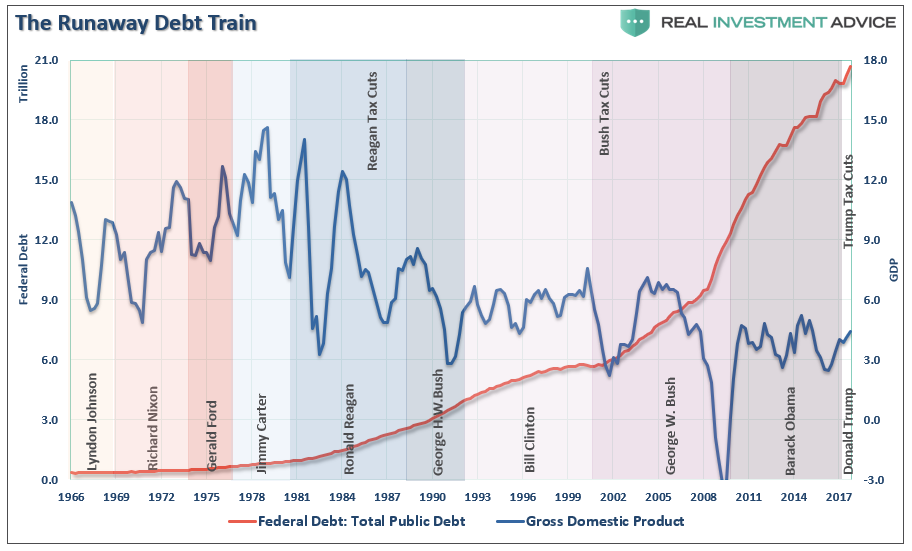
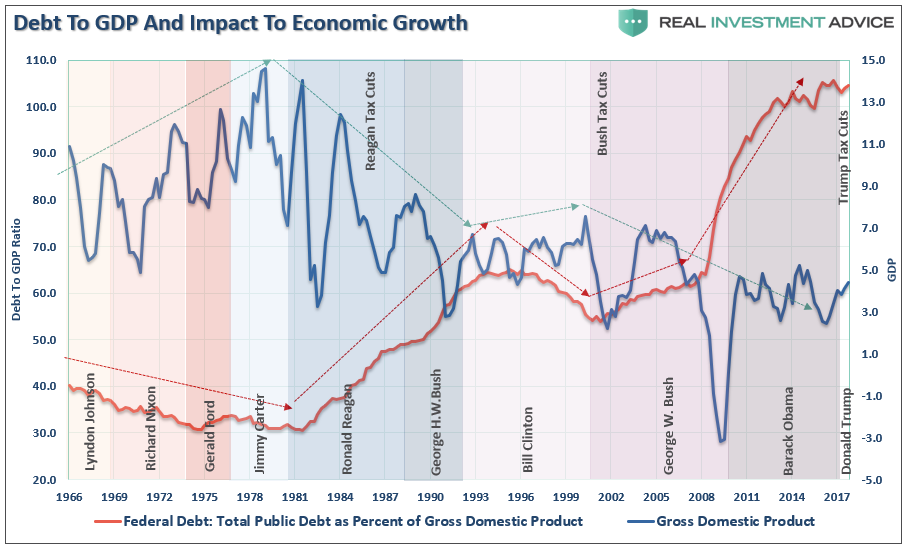
Debt is, by its very nature, a cancer on economic growth. As debt levels rise it consumes more capital by diverting it from productive investments into debt service. As debt levels spread through the system it consumes greater amounts of capital until it eventually kills the host. The chart below shows the rise of federal debt and its impact on economic growth.
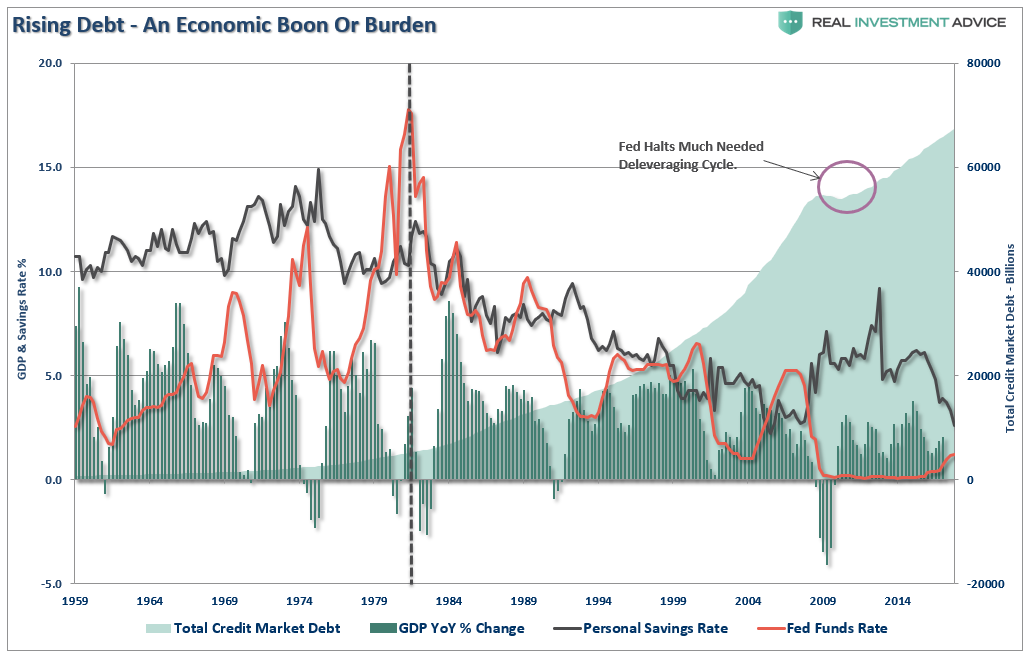
The reality is that the majority of the aggregate growth in the economy since 1980 has been financed by deficit spending, credit creation and a reduction in savings. This reduced productive investment in the economy and the output of the economy slowed. As the economy slowed, and wages fell, the consumer was forced to take on more leverage to maintain their standard of living which in turn decreased savings. As a result of the increased leverage more of their income was needed to service the debt – and with that, the “debt cancer” engulfed the system.
The Austrian business cycle theory attempts to explain business cycles through a set of ideas. The theory views business cycles:
“As the inevitable consequence of excessive growth in bank credit, exacerbated by inherently damaging and ineffective central bank policies, which cause interest rates to remain too low for too long, resulting in excessive credit creation, speculative economic bubbles and lowered savings.”
The problem that is yet not recognized by the current Administration and mainstream economists is that the excessive deficits and exponential credit creation can no longer be sustained. The process of a “credit contraction” will eventually occur over a long period of time as consumers and governments are ultimately forced to deal with the deficits.
The good news is the process of “clearing” the market will eventually allow resources to be reallocated back towards more efficient uses and the economy will begin to grow again at more sustainable and organic rates.
Today, however, expectations of a return to economic growth rates of the past are most likely just a fairy tale. The past 9-years of stock market returns have been fueled by trillions of dollars of support and direct injections into the financial system – that support is not sustainable in the long run. While the injections have kept the economy from falling into a depression in the short term –
There is no way to achieve the necessary goals “pain-free.” The time to implement austerity measures is when the economy is running a budget surplus and is close to full employment. That time was two Administrations ago when the economy would have slowed but could have absorbed and adjusted to the restrictive measures. However, when things are good, no one wants to “fix what isn’t broken”. The problem today is that with a high dependency on government support, high levels of underemployment and rising budget deficits, the implementation of austerity measures will only deter future economic growth, which is dependent on the very things that need to be “fixed”.
The processes that fueled the economic growth over the last 30 years are now beginning to run in reverse, and when combined with the demographic shifts in the U.S., the impact could be far more immediate and prolonged than the media, economists, and analysts are currently expecting. Sacrifices will have to be made, the economy will drag on at subpar rates of growth, individuals will be working far longer into their retirement years and the next generation of Americans will lead a far different life than what the currently retiring generation enjoyed.
It is simply a function of the math.
Lance Roberts
end
xxxxxxxxxxxxxxxxxxxxxxxxxxxxxxxxxxxxxxxxxxxxxxxxxxxxxxxxxxx
Feb 15/GOLD DOWN $2.45 TO $1352.95/SILVER DOWN 8 CENTS TO $16.84/HUGE EFP TRANSFER IN GOLD OF 22,672 CONTRACTS/SILVER EFP ISSUANCE: 1731 CONTRACTS/THE KEY USA/YEN CROSS PLUMMETS TO CLOSE TO 106.00/TWO BIG USA DATA POINTS TODAY; PPI IS SCORCHING HOT AND THAT MEANS INFLATION AROUND THE CORNER/INDUSTRIAL PRODUCTION FALTERS MEANING STAGFLATION MAY BE UPON US/MORE SWAMP STORIES FOR YOU TONIGHT/
February 15, 2018 · by harveyorgan · in Uncat
GOLD: $1352.95 DOWN $2.45
Silver: $16.84 DOWN 8 cents
Closing access prices:
Gold $1353.50
silver: $16.88
SHANGHAI GOLD FIX: FIRST FIX 10 15 PM EST (2:15 SHANGHAI LOCAL TIME)
SECOND FIX: 2:15 AM EST (6:15 SHANGHAI LOCAL TIME)
SHANGHAI FIRST GOLD FIX: $XXXX DOLLARS PER OZ
NY PRICE OF GOLD AT EXACT SAME TIME: $XXXX
PREMIUM FIRST FIX: $3.78
xxxxxxxxxxxxxxxxxxxxxxxxxxxxxxxxxxxxxxxxxxxxxx
SECOND SHANGHAI GOLD FIX: $XXXX
NY GOLD PRICE AT THE EXACT SAME TIME: $1333.50
discount of Shanghai 2nd fix/NY:$1.20
xxxxxxxxxxxxxxxxxxxxxxxxxxxxxxxxxxxxxxxxxxxxxxxxxxx
LONDON FIRST GOLD FIX: 5:30 am est $1353.70
NY PRICING AT THE EXACT SAME TIME: $1353.90
LONDON SECOND GOLD FIX 10 AM: $1352.45
NY PRICING AT THE EXACT SAME TIME. $1351.900
For comex gold:
FEBRUARY/
NUMBER OF NOTICES FILED TODAY FOR FEBRUARY CONTRACT: 1 NOTICE(S) FOR 100 OZ.
TOTAL NOTICES SO FAR:1784 FOR 178400 OZ (5.5489 TONNES),
For silver:
FEBRUARY
1 NOTICE(S) FILED TODAY FOR
5,000 OZ/
Total number of notices filed so far this month: 308 for 1,540,000 oz
XXXXXXXXXXXXXXXXXXXXXXXXXXXXXX
Bitcoin: BID $9638/OFFER $9714: up $198(morning)
Bitcoin: BID/ $99029/offer $9999: up $492 (CLOSING/5 PM)
end
Let us have a look at the data for today\
xxxxxxxxxxxxxxxxxxxxxxxxxxxxxxxxxxxxxxxxxxxxxxxxxxxxxxxxxxxxxxxxxxxxxxxxxx
In silver, the total open interest ROSE BY A HUGE SIZED 3070 contracts from 194,056 RISING TO 197,126 WITH YESTERDAY’S HUGE 35 CENT GAIN IN SILVER PRICING. WE HAD ZERO COMEX LIQUIDATION. HOWEVER, WE WERE AGAIN NOTIFIED THAT WE HAD ANOTHER GOOD SIZED NUMBER OF COMEX LONGS TRANSFERRING THEIR CONTRACTS TO LONDON THROUGH THE EFP ROUTE: 1731 EFP’S FOR MARCH AND AND 0 EFP’S FOR MAY AND ZERO FOR ALL OTHER MONTHS AND THUS TOTAL ISSUANCE OF 1731 CONTRACTS. WITH THE TRANSFER OF 1731 CONTRACTS, WHAT THE CME IS STATING IS THAT THERE IS NO SILVER (OR GOLD) TO BE DELIVERED UPON AT THE COMEX AS THEY MUST EXPORT THEIR OBLIGATION TO LONDON. ALSO KEEP IN MIND THAT THERE CAN BE A DELAY OF 24 HRS IN THE ISSUING OF EFP’S. THE 1731 CONTRACTS TRANSLATES INTO 8.915 MILLION OZ DESPITE WITH THE CONTINUAL DROP IN OPEN INTEREST IN SILVER AT THE COMEX.
ACCUMULATION FOR EFP’S/SILVER/ STARTING FROM FIRST DAY NOTICE/FOR MONTH OF FEBRUARY:
36,852 CONTRACTS (FOR 12 TRADING DAYS TOTAL 36,852 CONTRACTS OR 184.26 MILLION OZ: AVERAGE PER DAY: 3071 CONTRACTS OR 15.355 MILLION OZ/DAY)
TO GIVE YOU AN IDEA AS TO THE HUGE SUPPLY THIS MONTH IN SILVER: SO FAR THIS MONTH: 184.26 MILLION PAPER OZ HAVE MORPHED OVER TO LONDON. THIS REPRESENTS AROUND 26/32% OF ANNUAL GLOBAL PRODUCTION
ACCUMULATION IN YEAR 2018 TO DATE SILVER EFP’S: 432.60 MILLION OZ.
ACCUMULATION FOR JAN 2018: 236.879 MILLION OZ
RESULT: A HUGE SIZED GAIN IN OI SILVER COMEX WITH THE HUGE 35 CENT GAIN IN SILVER PRICE. WE ALSO HAD A GOOD SIZED EFP ISSUANCE OF 1731 CONTRACTS WHICH EXITED OUT OF THE SILVER COMEX AND TRANSFERRED THEIR OI TO LONDON AS FORWARDS. SPECULATORS CONTINUED THEIR INTEREST IN ATTACKING THE SILVER COMEX FOR PHYSICAL SILVER . FROM THE CME DATA 1731 EFP’S FOR MONTHS MARCH AND MAY WERE ISSUED FOR TODAY FOR A DELIVERABLE FORWARD CONTRACT OVER IN LONDON WITH A FIAT BONUS. WE GAINED 4801 OI CONTRACTS i.e. 1731 open interest contracts headed for London (EFP’s) TOGETHER WITH A INCREASE OF 3070 OI COMEX CONTRACTS. AND ALL OF THIS HAPPENED WITH THE HUGE RISE IN PRICE OF SILVER OF 35 CENTS AND A CLOSING PRICE OF $16.92 WITH RESPECT TO YESTERDAY’S TRADING. YET WE STILL HAVE A FAIR AMOUNT OF SILVER STANDING AT THE COMEX.
In ounces AT THE COMEX, the OI is still represented by just UNDER 1 BILLION oz i.e. 0.986 BILLION TO BE EXACT or 141% of annual global silver production (ex Russia & ex China).
FOR THE NEW FRONT FEBRUARY MONTH/ THEY FILED: 1 NOTICE(S) FOR 5,000 OZ OF SILVER
In gold, the open interest ROSE BY A HUMONGOUS 16,637 CONTRACTS UP TO 528,382 WITH THE GIGANTIC SIZED RISE IN PRICE OF GOLD WITH YESTERDAY’S TRADING ($27.40). HOWEVER, IN ANOTHER DEVELOPMENT, WE RECEIVED THE TOTAL NUMBER OF GOLD EFP’S ISSUED FOR TODAY AND IT TOTALED AN ATMOSPHERIC SIZED 22,672 CONTRACTS OF WHICH APRIL SAW THE ISSUANCE OF 21,922 CONTRACTS AND JUNE SAW THE ISSUANCE OF 750 CONTRACTS AND THEN ALL OTHER MONTHS ZERO. The new OI for the gold complex rests at 528,382. ALSO REMEMBER THAT THERE WILL BE A DELAY IN THE ISSUANCE OF EFP’S. THE BANKERS REMOVE LONG POSITIONS OF COMEX GOLD IMMEDIATELY. THEN THEY ORCHESTRATE THEIR PRIVATE EFP DEAL WITH THE LONGS AND THAT COULD TAKE AN ADDITIONAL 48 HRS SO WE GENERALLY DO NOT GET A MATCH WITH RESPECT TO DEPARTING COMEX LONGS AND NEW EFP LONG TRANSFERS. DEMAND FOR GOLD INTENSIFIES GREATLY AS WE CONTINUE TO WITNESS A HUGE NUMBER OF EFP TRANSFERS TOGETHER WITH THE MASSIVE INCREASE IN GOLD COMEX OI TOGETHER WITH THE TOTAL AMOUNT OF GOLD OUNCES STANDING FOR FEBRUARY COMEX. EVEN THOUGH THE BANKERS ISSUED THESE MONSTROUS EFPS, THE OBLIGATION STILL RESTS WITH THE BANKERS TO SUPPLY METAL BUT IT TRANSFERS THE RISK TO A LONDON BANKER OBLIGATION AND NOT A NEW YORK COMEX OBLIGATION. LONGS RECEIVE A FIAT BONUS TOGETHER WITH A LONG LONDON FORWARD. THUS, BY THESE ACTIONS, THE BANKERS AT THE COMEX HAVE JUST STATED THAT THEY HAVE NO APPRECIABLE METAL!! THIS IS A MASSIVE FRAUD: THEY CANNOT SUPPLY ANY METAL TO OUR COMEX LONGS BUT THEY ARE QUITE WILLING TO SUPPLY MASSIVE NON BACKED GOLD (AND SILVER) PAPER KNOWING THAT THEY HAVE NO METAL TO SATISFY OUR LONGS. LONDON IS NOW SEVERELY BACKWARD IN BOTH GOLD AND SILVER (BIG RISE IN BOTH GOFO AND SIFO) AND WE ARE WITNESSING DELAYS IN ACTUAL DELIVERIES. IN ESSENCE TODAY DESPITE YESTERDAY’S TRADING IN GOLD, WE HAVE A GAIN OF 39,309 CONTRACTS: 16,637 OI CONTRACTS INCREASED AT THE COMEX AND A GIGANTIC SIZED 22,672 OI CONTRACTS WHICH NAVIGATED OVER TO LONDON.(39,309 oi gain in CONTRACTS EQUATES TO 122.26 TONNES)
YESTERDAY, WE HAD 6481 EFP’S ISSUED.
ACCUMULATION OF EFP’S/ GOLD(EXCHANGE FOR PHYSICAL) FOR THE MONTH OF FEBRUARY STARTING WITH FIRST DAY NOTICE: 131,430 CONTRACTS OR 13,143,000 OZ OR 408.80 TONNES (12 TRADING DAYS AND THUS AVERAGING: 10,952 EFP CONTRACTS PER TRADING DAY OR 1,095,200 OZ/ TRADING DAY)
TO GIVE YOU AN IDEA AS TO THE HUGE SIZE OF THESE EFP TRANSFERS : SO FAR THIS MONTH IN 12 TRADING DAYS: IN TONNES: 408.80 TONNES
TOTAL ANNUAL GOLD PRODUCTION, 2017, THROUGHOUT THE WORLD EX CHINA EX RUSSIA: 2200 TONNES
THUS EFP TRANSFERS REPRESENTS 408.80/2200 x 100% TONNES = 18.58% OF GLOBAL ANNUAL PRODUCTION SO FAR IN FEBRUARY ALONE.
ACCUMULATION OF GOLD EFP’S YEAR 2018 TO DATE: 1042.2 TONNES
ACCUMULATION OF GOLD EFP’S FOR JANUARY 2018: 653.22 TONNES
Result: A HUGE SIZED INCREASE IN OI AT THE COMEX WITH THE HUGE SIZED GAIN IN PRICE IN GOLD TRADING YESTERDAY ($27.40). IT IS WITHOUT A DOUBT THAT MANY OF THE DEPARTED COMEX LONGS RECEIVED THEIR PRIVATE EFP CONTRACT FOR EITHER APRIL OR JUNE. HOWEVER, WE HAD ANOTHER GOOD SIZED NUMBER OF COMEX LONG TRANSFERRING TO LONDON THROUGH THE EFP ROUTE: 22,672 CONTRACTS AS THESE HAVE ALREADY BEEN NEGOTIATED AND CONFIRMED. THERE OBVIOUSLY DOES NOT SEEM TO BE MUCH PHYSICAL GOLD AT THE COMEX AND YET WE ALSO OBSERVED A HUGE DELIVERY MONTH FOR THE MONTH OF DECEMBER. I GUESS IT EXPLAINS THE HUGE ISSUANCE OF EFP’S…THERE IS HARDLY ANY GOLD PRESENT AT THE GOLD COMEX FOR DELIVERY PURPOSES. IF YOU TAKE INTO ACCOUNT THE 22,672 EFP CONTRACTS ISSUED, WE HAD A NET GAIN IN OPEN INTEREST OF 39,309 contracts ON THE TWO EXCHANGES:
22,672 CONTRACTS MOVE TO LONDON AND 16,637 CONTRACTS INCREASED AT THE COMEX. (in tonnes, the GAIN in total oi equates to 122.26 TONNES).
we had: 1 notice(s) filed upon for 100 oz of gold.
xxxxxxxxxxxxxxxxxxxxxxxxxxxxxxxxxxxxxxxxxxxxxxxxxxxxxxxxxxx
With respect to our two criminal funds, the GLD and the SLV:
GLD
WITH GOLD DOWN $2.45 TODAY, NO CHANGE IN GOLD INVENTORY AT THE GLD/
Inventory rests tonight: 823.66 tonnes.
SLV/
NO CHANGES IN SILVER INVENTORY AT THE SLV/ AGAIN WITH TODAY’S HUGE RISE IN SILVER PRICE: NO CHANGE IN INVENTORY
/INVENTORY RESTS AT 314.045 MILLION OZ/
end
First, here is an outline of what will be discussed tonight:
1. Today, we had the open interest in silver ROSE BY A HUGE 3070 contracts from 194,056 UP TO 197,126 (AND now A LITTLE FURTHER TO THE NEW COMEX RECORD SET ON FRIDAY/APRIL 21/2017 AT 234,787) DESPITE THE HUGE SIZED FALL IN PRICE OF SILVER (35 CENTS WITH RESPECT TO YESTERDAY’S TRADING). OUR BANKERS USED THEIR EMERGENCY PROCEDURE TO ISSUE ANOTHER GOOD 1731 PRIVATE EFP’S FOR MARCH AND 0 EFP CONTRACTS OR MAY (WE DO NOT GET A LOOK AT THESE CONTRACTS AS IT IS PRIVATE BUT THE CFTC DOES AUDIT THEM) AND 0 EFP’S FOR ALL OTHER MONTHS . EFP’S GIVE OUR COMEX LONGS A FIAT BONUS PLUS A DELIVERABLE PRODUCT OVER IN LONDON. WE HAD SOME COMEX SILVER COMEX LIQUIDATION. IF WE TAKE THE OI GAIN AT THE COMEX OF 3070 CONTRACTS TO THE 1731 OI TRANSFERRED TO LONDON THROUGH EFP’S, WE OBTAIN A GAIN OF 4801 OPEN INTEREST CONTRACTS . WE STILL HAVE A GOOD AMOUNT OF SILVER OUNCES THAT ARE STANDING FOR METAL IN JANUARY (SEE BELOW). THE NET GAIN TODAY IN OZ ON THE TWO EXCHANGES: 24.00 MILLION OZ!!!
RESULT: A HUGE SIZED INCREASE IN SILVER OI AT THE COMEX WITH THE HUGE SIZED GAIN OF 35 CENTS IN PRICE (WITH RESPECT TO YESTERDAY’S TRADING ). BUT WE ALSO HAD ANOTHER GOOD 1731 EFP’S ISSUED TRANSFERRING COMEX LONGS OVER TO LONDON. TOGETHER WITH THE GOOD SIZED AMOUNT OF SILVER OUNCES STANDING FOR FEBRUARY, DEMAND FOR PHYSICAL SILVER INTENSIFIES AS WE WITNESS MAJOR BANK SHORT COVERING ACCOMPANIED BY INCREASES IN GOFO AND SIFO RATES INDICATING SCARCITY.
(report Harvey)
.
2.a) The Shanghai and London gold fix report
(Harvey)
2 b) Gold/silver trading overnight Europe, Goldcore
(Mark O’Byrne/zerohedge
and in NY: Bloomberg
3. ASIAN AFFAIRS
)Late WEDNESDAY night/THURSDAY morning: Shanghai closed /Hang Sang CLOSED UP 599.83 or 1.97% / The Nikkei closed UP 310.81 POINTS OR 1.47%/Australia’s all ordinaires CLOSED UP 1.16%/Chinese yuan (ONSHORE) closed UP at 6.3415/Oil DOWN to 60.58 dollars per barrel for WTI and 63.84 for Brent. Stocks in Europe OPENED DEEPLY IN THE GREEN . ONSHORE YUAN CLOSED UP AGAINST THE DOLLAR AT 6.3415. OFFSHORE YUAN CLOSED UP AGAINST THE ONSHORE YUAN AT 6.2980//ONSHORE YUAN A LITTLE STRONGER AGAINST THE DOLLAR/OFF SHORE A LOT STRONGER TO THE DOLLAR/. THE DOLLAR (INDEX) IS A LOT WEAKER AGAINST ALL MAJOR CURRENCIES . CHINA IS HAPPY TODAY AS THEY BEGIN THEIR NEW YEAR ONE WEEK HOLIDAY TOMORROW
3a)THAILAND/SOUTH KOREA/NORTH KOREA
i)North Korea
b) REPORT ON JAPAN
Last night the Yen rose as Japanese machine orders crashed 11.9% month over month. Before central bank intervention the USA/Yen came close to 106.50
( zerohedge)
3 c CHINA
4. EUROPEAN AFFAIRS
5. RUSSIAN AND MIDDLE EASTERN AFFAIRS
6 .GLOBAL ISSUES
Seems that Chinese buyers have stopped buying Canadian properties: Cdn existing home sales crash in January.
( zero hedge)
7. OIL ISSUES
8. EMERGING MARKET
9. PHYSICAL MARKETS
Agnico Eagle beats the street by 2 cents. It also increases production guidance for both 2018 and 2019 and most importantly adds dramatically to its reserves to 20.6 million oz/
In times past, the most important part of the earnings report for major mining companies is not the income side of things but the reserves and the future production and costs. The street (the bankers) focused on current income instead of what is coming in the future.
( Agnico Eagle)
10. USA stories which will influence the price of gold/silver
i)Producer prices is generally considered a forerunner of inflation. Today’s reading shows PPI rose far more than expected in January, rising a good 2.7% year over year.
( zerohedge)
ii)Two regional Fed manufacturing reports send conflicting signals: The New York survey slid showing a slowdown but the Philly area survey rose.
However the key prices paid component which always leads to inflation rose in both surveys
( zerohedge)
ii b)Stagflation strikes with a vengeance as Industrial production sinks badly. So with the latest data provided, we inflation surging but the economy faltering.
(courtesy zerohedge)
iii)Trump agrees with some Democrats supporting a 25 cent Federal gas tax to help pay for infrastructure
( zerohedge)
iv)We have been telling you quite often that Trump wants his wall and block family migration. He now threatens the bipartisan immigration deal as there is no wall in the agreement
(courtesy zerohedge)
v)Part ii/ The folly of Central Bankers Keynesian philosophy
(courtesy David Stockman/ContraCorner Part ii)
vi)
A good article on the suspension of the Debt ceiling and where the USA debt is heading with respect to March 1.2019 where it is intended to be reinstated. The pundits figure that by that date the debt ceiling will be 22 trillion USA dollars
(courtesy Dave Kranzler/IRD)
vii)SWAMP STORIES
a)My goodness!! Adam Schiff now admits that the Democratic Memo contains “sources and methods”. It is interesting that he scolded the Republicans not to release their memo because it contained “sources and methods”
( zerohedge)
b)This does not look good for Kushner: both the IRS and the Dept of Justice subpoena investors in the Kushner companies.
( zerohedge)
c)I think most of expected this: Bruce Ohr hid his wife’s Fusion GPS payments form ethic officials as Bruce Ohr refused to obtain a conflict of interest waiver
( Luke Rosiak/DailyCaller)
Let us head over to the comex:
The total gold comex open interest ROSE BY A GIGANTIC 16,637 CONTRACTS UP to an OI level 528,382 WITH THE HUGE SIZED RISE IN THE PRICE OF GOLD ($27.40 GAIN WITH RESPECT TO YESTERDAY’S TRADING). WE HAD ZERO COMEX GOLD LIQUIDATION. HOWEVER THE CME REPORTS THAT THE BANKERS ISSUED ANOTHER STRONG COMEX TRANSFER THROUGH THE EFP ROUTE AS THESE LONGS RECEIVED A DELIVERABLE LONDON FORWARD TOGETHER WITH A FIAT BONUS. WE HAD AN ATMOSPHERIC SIZED 21922 EFP’S ISSUED FOR APRIL AND 750 EFP’s FOR JUNE AND ZERO FOR ALL OTHER MONTHS: TOTAL 22,672 CONTRACTS. THE OBLIGATION STILL RESTS WITH THE BANKERS ON THESE TRANSFERS. ALSO REMEMBER THAT THERE IS NO DOUBT A HUGE DELAY IN THE ISSUANCE OF EFP’S AND IT PROBABLY TAKES AT LEAST 48 HRS AFTER LONGS GIVE UP THEIR COMEX CONTRACTS FOR THEM TO RECEIVE THEIR EFP’S AS THEY ARE NEGOTIATING THIS CONTRACT WITH THE BANKS FOR A FIAT BONUS PLUS THEIR TRANSFER TO A LONDON FORWARD… THE COMEX IS NOW AN ABSOLUTE FRAUD!!
ON A NET BASIS IN OPEN INTEREST WE GAINED TODAY: 39,309 OI CONTRACTS IN THAT 22,672 LONGS WERE TRANSFERRED AS FORWARDS TO LONDON AND WE GAINED 16,637 COMEX CONTRACTS.
NET GAIN ON THE TWO EXCHANGES: 39,309 contracts OR 3,930,900 OZ OR 122.26 TONNES.
Result: A GIGANTIC SIZED INCREASE IN COMEX OPEN INTEREST WITH THE HUGE SIZED GAIN IN YESTERDAY’S GOLD TRADING ($27.40.) WE HAD ZERO COMEX GOLD LIQUIDATION. TOTAL OPEN INTEREST GAIN ON THE TWO EXCHANGES: 39,309 OI CONTRACTS..
We have now entered the active contract month of FEBRUARY where we lost 7 contracts to 1140 contracts. We had 0 notices filed upon yesterday, so we LOST 7 contracts or an additional 700 oz will NOT stand in this active contract month of February AND THEY JOINED OTHER EFP’S IN TRANSFERRING FOR A LONDON FORWARD.
March saw a GAIN of 183 contracts UP to 2299. April saw a GAIN of 16,639 contracts UP to 368,487. MARCH BECOMES THE FRONT MONTH FOR GOLD
We had 1 notice(s) filed upon today for 100 oz
PRELIMINARY COMEX VOLUME FOR TODAY: 459,239 contracts
CONFIRMED COMEX VOL. FOR YESTERDAY: 214,289 CONTRACTS
comex gold volumes are RISING AGAIN
Here is a summary of the latest gold trading volumes at the Comex per year
certainly the introduction of EFP’s has certainly had an effect:
Trading Volumes on the COMEX
Meanwhile, gold-trading volumes on the COMEX have never been higher:
end
xxxxxxxxxxxxxxxxxxxxxxxxxxxxxxxxxxxxxxxxxxxxxxxxxxxxxxxxxxxxxxxxxxxx
And now for the wild silver comex results.
Total silver OI ROSE BY A HUGE SIZED 3070 CONTRACTS FROM 194,056 UP TO 197,126 WITH YESTERDAY’S HUGE SIZED 35 CENT FALL IN TRADING). HOWEVER,WE WERE ALSO INFORMED THAT WE HAD ANOTHER HUGE SIZED 1731 EMERGENCY EFP’S FOR MARCH ISSUED BY OUR BANKERS (WITH 143 EFP CONTRACTS FOR MAY AND ZERO FOR ALL OTHER MONTHS) TO COMEX LONGS WHO RECEIVED A FIAT BONUS PLUS A DELIVERABLE PRODUCT OVER IN LONDON: THE TOTAL EFP’S ISSUED: 1731. THE SILVER BOYS HAVE STARTED TO MIGRATE TO LONDON FROM THE START OF DELIVERY MONTH AND CONTINUING RIGHT THROUGH UNTIL FIRST DAY NOTICE JUST LIKE WE ARE WITNESSING TODAY. USUALLY WE NOTED THAT CONTRACTION IN OI OCCURRED ONLY DURING THE LAST WEEK OF AN UPCOMING ACTIVE DELIVERY MONTH AS WE HAVE JUST SEEN IN GOLD TODAY. THIS PROCESS HAS JUST BEGUN IN EARNEST IN SILVER STARTING IN SEPTEMBER 2017. HOWEVER, IN GOLD, WE HAVE BEEN WITNESSING THIS FOR THE PAST 2 YEARS. NICK LAIRD WAS KIND ENOUGH TO SUPPLY US THE TOTAL FOR 2017 GOLD EFP’S AND IT WAS 6600 TONNES FOR THE ENTIRE YEAR. WE OBVIOUSLY HAD NO LONG COMEX SILVER LIQUIDATION BUT A HUGE SIZED GAIN IN TOTAL SILVER OI. WE ARE ALSO WITNESSING A FAIR AMOUNT OF SILVER OUNCES STANDING FOR COMEX METAL IN THIS NON ACTIVE JANUARY AS WELL AS THAT CONTINUAL MIGRATION OF EFPS OVER TO LONDON. ON A PERCENTAGE BASIS THERE ARE MORE EFP’S ISSUED FOR GOLD THAN SILVER. ON A NET BASIS WE GAINED 4801 SILVER OPEN INTEREST CONTRACTS:
3070 CONTRACT GAIN AT THE COMEX COMBINING WITH THE ADDITION OF 1731 OI CONTRACTS NAVIGATING OVER TO LONDON.
NET GAIN TWO EXCHANGES: 4801 CONTRACTS
We are now in the poor non active delivery month of FEBRUARY and here the front month GAINED 198 contracts UP TO 254 contracts. We had 3 notices filed upon yesterday so we GAINED 195 contracts or 975,000 ADDITIONAL oz will stand for delivery at the comex
The March contract lost 969 contracts DOWN to 87,303
April GAINED 59 contracts UP to 155 .
.
We had 3 notice(s) filed for 15,000 OZ for the FEBRUARY 2018 contract for silver
INITIAL standings for FEBRUARY
Feb 15/2018.
Gold Ounces
Withdrawals from Dealers Inventory in oz nil oz
Withdrawals from Customer Inventory in oz
190.24 oz
Delaware
Deposits to the Dealer Inventory in oz nil oz
Deposits to the Customer Inventory, in oz
No of oz served (contracts) today
1 notice(s)
100 OZ
No of oz to be served (notices)
1139 contracts
(113900 oz)
Total monthly oz gold served (contracts) so far this month
1784 notices
178400 oz
5.5489 tonnes
Total accumulative withdrawals of gold from the Dealers inventory this month NIL oz
Total accumulative withdrawal of gold from the Customer inventory this month xxx oz
we had 0 kilobar transaction/
We had 0 inventory movement at the dealer accounts
total inventory deposit into the dealer accounts: nil oz
we had 1 withdrawal out of the customer account:
i) out of Delaware: 190.24 oz
total withdrawal: 190/24 oz
we had 0 customer deposit
total customer deposits: nil oz
we had 0 adjustments
total registered or dealer gold: 402,632,052 oz or 12.52 tonnes
total registered and eligible (customer) gold; 9,108,086.938 oz 283.30 tones
For FEBRUARY:
Today, 0 notice(s) were issued from JPMorgan dealer account and 1 notices were issued from their client or customer account. The total of all issuance by all participants equates to 1 contract(s) of which 1 notices were stopped (received) by j.P. Morgan dealer and 0 notice(s) was (were) stopped/ Received) by j.P.Morgan customer account.
xxxxxxxxxxxxxxxxxxxxxxxxxxxxxxxxxxxxxxxxxxxxxxxxxxxxxxxxxxxxxxxxxxxxxxxxxx
To calculate the INITIAL total number of gold ounces standing for the FEBRUARY. contract month, we take the total number of notices filed so far for the month (1784) x 100 oz or 178,300 oz, to which we add the difference between the open interest for the front month of FEB. (1140 contracts) minus the number of notices served upon today (1 x 100 oz per contract) equals 292,300 oz, the number of ounces standing in this active month of FEBRUARY
Thus the INITIAL standings for gold for the FEBRUARY contract month:
No of notices served (1784 x 100 oz or ounces + {(1140)OI for the front month minus the number of notices served upon today (1 x 100 oz )which equals 292,300 oz standing in this active delivery month of February (9.091 tonnes). THERE IS 12.52 TONNES OF REGISTERED GOLD AVAILABLE FOR DELIVERY SO FAR.
WE LOST 7 CONTRACTS OR AN ADDITIONAL 700 OZ WILL NOT STAND IN THIS ACTIVE DELIVERY MONTH OF FEBRUARY.
THE COMEX IS NOW UNDER STRESS AS THE REGISTERED GOLD FALLS BELOW 13 TONNES AS WELL AS HUGE NUMBER OF TONNES LEAVING THE CUSTOMER ACCOUNT
xxxxxxxxxxxxxxxxxxxxxxxxxxxxxxxxxxxxxxxxxxxxxxxxxxxxxxxxxxxxxxxxxxxxxxx
XXXXXXXXXXXXXXXXXXXXXXXXXXXXXXXXXXXXXXXXXXXXXXXX
IN THE LAST 17 MONTHS 71 NET TONNES HAS LEFT THE COMEX.
end
And now for silver
AND NOW THE DECEMBER DELIVERY MONTH
FEBRUARY FINAL standings
feb 15 2018
Silver Ounces
Withdrawals from Dealers Inventory nil oz
Withdrawals from Customer Inventory
1,806,683.364 oz
CNT
Delaware
Scotia
Deposits to the Dealer Inventory
nil
oz
Deposits to the Customer Inventory
1 573,745.260 oz
JPM
Scotia
No of oz served today (contracts)
1
CONTRACT(S
(5,000 OZ)
No of oz to be served (notices)
253 contracts
(1,265,000 oz)
Total monthly oz silver served (contracts) 308 contracts
(1,540,000 oz)
Total accumulative withdrawal of silver from the Dealers inventory this month NIL oz
Total accumulative withdrawal of silver from the Customer inventory this month
we had zero inventory movement at the dealer side of things
total inventory movement dealer: nil oz
we had 2 inventory deposits into the customer account
i) into J.P.MORGAN:994,507.590 oz ***
ii) Into Scotia: 579,237.620 oz
total inventory deposits: 1,573,745.260 oz
*** JPMorgan is continually adding to its inventory almost every single day.
JPMorgan now has 133 million oz of total silver inventory or 53% of all official comex silver.
we had 3 withdrawals from the customer account;
i) Out of Scotia: 544,315.070
ii) Out of CNT: 748,808.164 oz
iii) Out of Delaware:: 512,619.730 oz
total withdrawals; 65,079.95 oz
we had 0 adjustment
total dealer silver: 43.827 million
total dealer + customer silver: 252.477 million oz
The total number of notices filed today for the FEBRUARY. contract month is represented by 1 contract(s) FOR 5,000 oz. To calculate the number of silver ounces that will stand for delivery in FEBRUARY., we take the total number of notices filed for the month so far at 308 x 5,000 oz = 1,540,000 oz to which we add the difference between the open interest for the front month of FEB. (56) and the number of notices served upon today (1 x 5000 oz) equals the number of ounces standing.
.
Thus the INITIAL standings for silver for the FEB contract month: 308(notices served so far)x 5000 oz + OI for front month of FEBRUARY(254) -number of notices served upon today (1)x 5000 oz equals 2,805,000 oz of silver standing for the FEBRUARY contract month.
WE GAINED 195 CONTRACTS OR AN ADDITIONAL 975,000 OZ WILL STAND AT THE COMEX. SOMEBODY WAS BADLY IN DEEP OF PHYSICAL SILVER AT THE COMEX
xxxxxxxxxxxxxxxxxxxxxxxxxxxxxxxxxxxxxxxxxxxxxxxxxxxxxxxxxxx
ESTIMATED VOLUME FOR TODAY: 91,562 CONTRACTS
CONFIRMED VOLUME FOR YESTERDAY: 119,981 CONTRACTS
YESTERDAY’S CONFIRMED VOLUME OF 119,981 CONTRACTS EQUATES TO 600 MILLION OZ OR 85.6% OF ANNUAL GLOBAL PRODUCTION OF SILVER
COMMODITY LAW SUGGESTS THAT OPEN INTEREST SHOULD NOT BE MORE THAN 3% OF ANNUAL GLOBAL PRODUCTION. THE CROOKS ARE SUPPLYING MASSIVE PAPER TRYING TO KEEP SILVER IN CHECK.
The record level of silver open interest is 234,787 contracts set on April 21./2017 with the price at that day at $18.42
The previous record was 224,540 contracts with the price at that time of $20.44
end
NPV for Sprott
1. Sprott silver fund (PSLV): NAV RISES TO -1.83% (FEB 14/2018)
2. Sprott gold fund (PHYS): premium to NAV RISES TO -0.34% to NAV (FEB 14/2018 )
Note: Sprott silver trust back into NEGATIVE territory at -1.83%-/Sprott physical gold trust is back into NEGATIVE/ territory at -0.34%/Central fund of Canada’s is still in jail but being rescued by Sprott.
Sprott WINS hostile 3.1 billion bid to take over Central Fund of Canada
(courtesy Sprott/GATA)
3.SPROTT CEF.A FUND (FORMERLY CENTRAL FUND OF CANADA): NAV FALLS TO -3.75%: NAV 13.96/TRADING 13.44//DISCOUNT 4.41%
END
And now the Gold inventory at the GLD/
Feb 15/NO CHANGE IN GOLD INVENTORY AT THE GLD/INVENTORY RESTS AT 823.66 TONNES
Feb 14/AN ADDITIONAL OF 2.95 TONNES OF GOLD INTO GLD WITH THE HUGE GAIN OF 27.40 IN PRICE/INVENTORY RESTS AT 823.66 TONNES
Feb 13/WITH GOLD UP $3.40 WE HAD NO CHANGE IN GOLD INVENTORY AT THE GLD/INVENTORY REMAINS AT 820.71 TONNES
Feb 12/STRANGE!!WITH GOLD RISING BY 12.00 DOLLARS, THE CROOKS DECIDED AGAIN TO WITHDRAW 5.6 TONNES OF GOLD FOR EMERGENCY USE ELSEWHERE/INVENTORY RESTS AT 820.71 TONNES
Feb 9/AGAIN WITH HUGE TURMOIL ON THE MARKETS, THE CROOKS WITHDREW 2 TONNES OF GOLD FROM THE GLD INVENTORY/INVENTORY RESTS AT 826.31 TONNES
Feb 8/DESPITE THE GOOD GAIN IN PRICE FOR GOLD TODAY/THE CROOKS REMOVED .96 TONNES FROM THE GLD INVENTORY/INVENTORY RESTS AT 828.31 TONNES
FEB 7/AN UNBELIEVABLE 12.08 TONNES WAS REMOVED BY THE CROOKED BANKERS AND THIS GOLD WAS USED IN THE ASSAULT THESE PAST FEW DAYS/INVENTORY RESTS AT 829.27 TONNES
Feb 6/AGAIN VERY STRANGE: WITH TODAY’S TURMOIL, THE CROOKS DID NOT ADD ANY GOLD INVENTORY INTO THE GLD/INVENTORY REMAINS AT 841.35 TONNES
Feb 5 Strange,with all of today’s turmoil, the crooks at the GLD decided to add zero ounces into GLD inventory/inventory rests at 841.35 tonnes
Feb 2/no change in gold inventory at the GLD/Inventory rests at 841.35 tonnes
Feb 1/with gold up by $8.00/the crooks decided not to add any new physical gold metal into the GLD./inventory rests at 841.35 tonnes
Jan 31/with gold up $3.15 today, GLD shed another 5.32 tonnes of gold from its inventory/inventory rests at 841.35 tonnes
jan 30/with gold down by $4.85/GLD shed another 1.47 tonnes of gold from its inventory/inventory rests at 846.67 tonnes
JAN 29/with gold down $11.25, the GLD shed 1.18 tonnes of gold/inventory rests at 848.14 tonnes
jan 26/2018/no changes in gold inventory at the GLD/inventory rests at 849.32 tonnes
jan 25/no changes in gold inventory at the GLD/inventory rests at 849.32 tonnes
Jan 24/A HUGE DEPOSIT OF 2.65 TONNES OF GOLD INTO GLD/INVENTORY RESTS AT 849.32 TONNES
Jan 23/NO CHANGE IN GOLD INVENTORY DESPITE GOLD’S RISE/INVENTORY RESTS AT 846.67 TONNES
Jan 22/a huge deposit of 5.71 tonnes of gold despite a drop in price/inventory rests at 846.67 tonnes. In 3 trading days, the GLD has added 17.71 tonnes/the bankers are now in trouble!!
Jan 19/no change in gold inventory at the GLD/Inventory rests at 840.76 tonnes
Jan 18/SHOCKINGLY A HUGE DEPOSIT OF 11.80 TONNES WITH GOLD DOWN ALMOST $12.00/INVENTORY RESTS AT 840.76
Jan 17/no changes in gold inventory at the GLD/inventory rests at 828.96 tonnes
Jan 16/NO CHANGES IN GOLD INVENTORY AT THE GLD/INVENTORY RESTS AT 828.96 TONNES
Jan 12/no changes in inventory at the GLD despite the rise in gold price/inventory rests at 828.96 tonnes
Jan 11/ANOTHER IDENTICAL WITHDRAWAL OF 2.95 TONNES FROM THE GLD INVENTORY/INVENTORY RESTS AT 828.96 TONNES
xxxxxxxxxxxxxxxxxxxxxxxxxxxxxxxxxx
Feb 15/2018/ Inventory rests tonight at 823.66 tonnes
*IN LAST 326 TRADING DAYS: 117.49 NET TONNES HAVE BEEN REMOVED FROM THE GLD
*LAST 256 TRADING DAYS: A NET 39.82 TONNES HAVE NOW BEEN ADDED INTO GLD INVENTORY.
end
Now the SLV Inventory
Feb 15/NO CHANGE IN SILVER INVENTORY AT THE SLV/INVENTORY RESTS AT 314.045 MILLION OZ/
Feb 14./NO CHANGE IN SILVER INVENTORY DESPITE THE HUGE RISE IN PRICE/INVENTORY RESTS AT 314.045 MILLION OZ
Feb 13./NO CHANGE IN SILVER INVENTORY TODAY/INVENTORY RESTS AT 314.045 MILLION OZ/
Feb 12/AGAIN, WITH TODAY’S HUGE RISE IN SILVER PRICE, IN TOTAL CONTRAST TO GOLD: NO CHANGE IN SILVER INVENTORY/INVENTORY RESTS AT 314.045 MILLION OZ/
Feb 9/AGAIN WITH TURMOIL ON THE MARKETS, STRANGELY IN TOTAL CONTRAST TO GOLD: NO CHANGE IN SILVER INVENTORY/INVENTORY RESTS AT 314.045 MILLION OZ/
Feb 8/DESPITE THE TURMOIL TODAY AND A PRICE RISE: NO CHANGE IN SILVER INVENTORY AT THE SLV/INVENTORY RESTS AT 314.045 MILLION OZ/
FEB 7/no change in silver inventory at the SLV/Inventory rests at 314.045 million oz/
Feb 6/WITH ALL OF TODAY’S TURMOIL/NO CHANGE IN SILVER INVENTORY AT THE SLV/INVENTORY RESTS AT 314.045 MILLION OZ/
Feb 5/ we had HUGE change in silver inventory at the SLV/ A DEPOSIT OF 1.131 MILLION OZ INTO THE SLV/Inventory rests at 314.045 million oz/
Feb 2/we lost 982,000 oz from the SLV inventory /inventory rests at 312.914 million oz/
Feb 1/no change in silver inventory at the SLV/Inventory rests at 313.896 million oz/
Jan 31/ no change in inventory at the slv in total contrast to gold/inventory rests at 313.896 million oz/
Jan 30/no change in inventory/SLV inventory rests at 313.896 million oz/
Jan 29/no change in inventory/SLV inventory rests at 313.896 million oz/
Jan 26.2018/inventory rests at 313.896 million oz
Jan 25/with silver up today and yesterday, the SLV could only muster a gain of 848,000 oz
Inventory rests at 313.896 oz
jan 24/NO CHANGE IN SILVER INVENTORY DESPITE THE GOOD ADVANCE IN PRICE/INVENTORY RESTS AT 313.048 MILLION OZ/
Jan 23/ANOTHER HUGE WITHDRAWAL OF 1.131 MILLION OZ OF SILVER DESPITE THE TINY LOSS/THE CROOKS ARE USING THE INVENTORY TO RAID ON SILVER.
JAN 22.2018/with silver down by 5 cents/ the crooks at the SLV liquidate 1.321 million oz of silver/inventory rests at 314.179 million oz/
Jan 19/ no changes in silver inventory at the SLV/inventory rests at 315.500 million oz/
jan 18/A WITHDRAWAL OF 848,000 OZ OF SILVER FROM THE SLV/INVENTORY RESTS AT 315.500 MILLION OZ/
Jan 17/no changes in silver inventory at the SLV/inventory rests at 316.348 million oz/
Jan 16/NO CHANGES IN SILVER INVENTORY AT THE SLV/INVENTORY RESTS AT 316.348 MILLION OZ
Jan 12/no changes in silver inventory at the SLV/inventory rests at 316.348 million oz/
Feb 14/2017:
Inventory 314.045 million oz
end
6 Month MM GOFO
Indicative gold forward offer rate for a 6 month duration
+ 1.70%
12 Month MM GOFO
+ 2.10%
end
Major gold/silver trading /commentaries for THURSDAY
GOLDCORE/BLOG/MARK O’BYRNE.
GOLD/SILVER
GoldCore
Is The Gold Price Heading Higher? IG TV Interview GoldCore
15, February
Is The Gold Price Heading Higher? IG TV Interview GoldCore
Research Director at GoldCore, Mark O’Byrne talks to IG TV’s Victoria Scholar about the outlook for the gold price.
In this interview, Mark O’Byrne, research director at Goldcore, says the fact that the gold price did not spike during last week’s equity sell-off was to be expected.
He said even at the height of the global financial crisis, amid the collapse in the Wall Street behemoth Lehman Brothers, gold prices fell. O’Byrne says gold’s hedge abilities and safe haven attributes are seen more in the medium to long term. Also, he points out that there was a big move up in December in the gold price, so a period of correction was expected.
O’Byrne says periods of rising interest rates have historically coincided with bull markets for gold. He cites the 1970s, and the period between 2003 and 2007, when gold prices did very well.
In terms of key levels, O’Byrne says there is resistance around $1360 before we head to $1400. He says he is cautious in the short term but feeling constructive for 2018 overall, and says $1500 is quite likely by autumn, although it could end 2018 above $1400.
Watch Interview On IG TV Here
News and Commentary
Gold holds steady near 2-1/2-week high as dollar dips (Reuters.com)
Paulson Maintained SPDR Gold Stake as Dollar Boosted Metal (Bloomberg.com)
Gold rallies to highest settlement in nearly 3 weeks on hotter-than-expected CPI (MarketWatch.com)
Gold quickly reverses US CPI-led fall, jumps back closer to session tops (FXStreet.com)
Gold rebounds from U.S inflation data-driven losses as dollar wilts (Reuters.com)
Source: Bloomberg
Gold Shines as Traders Count Down to ‘Critical’ CPI, Dalio Buys (Bloomberg.com)
Dalio’s Bridgewater Boosts Holdings in Gold (Bloomberg.com)
These Are the World’s Most Miserable Economies (Bloomberg.com)
Williams: “It’s The Long-Term Insolvency Of The US Government That Markets Don’t Like” (ZeroHedge.com)
Bullish Fundamentals To Push Gold Above $3,000 by 2020 (Gold-Eagle.com)
Gold Prices (LBMA AM)
14 Feb: USD 1,330.75, GBP 959.74 & EUR 1,077.77 per ounce
13 Feb: USD 1,329.40, GBP 955.04 & EUR 1,077.61 per ounce
12 Feb: USD 1,321.70, GBP 955.19 & EUR 1,077.45 per ounce
09 Feb: USD 1,316.05, GBP 945.58 & EUR 1,072.84 per ounce
08 Feb: USD 1,311.05, GBP 944.87 & EUR 1,071.13 per ounce
07 Feb: USD 1,328.50, GBP 956.12 & EUR 1,075.95 per ounce
06 Feb: USD 1,344.65, GBP 962.50 & EUR 1,083.52 per ounce
Silver Prices (LBMA)
14 Feb: USD 16.58, GBP 11.97 & EUR 13.43 per ounce
13 Feb: USD 16.61, GBP 11.94 & EUR 13.46 per ounce
12 Feb: USD 16.43, GBP 11.86 & EUR 13.39 per ounce
09 Feb: USD 16.36, GBP 11.83 & EUR 13.37 per ounce
08 Feb: USD 16.35, GBP 11.70 & EUR 13.36 per ounce
07 Feb: USD 16.69, GBP 12.02 & EUR 13.52 per ounce
06 Feb: USD 16.81, GBP 12.07 & EUR 13.59 per ounce
Recent Market Updates
– Global Debt Crisis II Cometh
– Sovereign Wealth Funds Investing In Gold For “Long Term Returns” – PwC
– Bitcoin and Crypto Prices Being Manipulated Like Precious Metals?
– “This Is Where They Completely Lost Their Minds” – Hussman
– Brexit Risks Increase – London Property Market and Pound Vulnerable
– Peak Gold: Global Gold Supply Flat In 2017 As China Output Falls By 9%
– Crypto Currency Backlash Sees Flight From Cryptos and Bitcoin
– Gold Rises As Global Stocks Plunge and Bitcoin Crashes 70%
– Shrinkflation Intensifies – Stealth Inflation As Thousands of Food Products Shrink In Size, Not Price
– U.S. Debt Is “Extraordinarily High” and Are Stock And Bond Bubbles – Greenspan
– Gold Bullion Price Suppression To End? Bullion Bank Traders Arrested For Manipulating Market
– ATMs Hit By Malware “Jackpotting” Attacks That Dispense All Cash In Minutes
– London Property Market Tumbles As Glut of Luxury Apartments Grows To 3,000
Mark O’Byrne
Executive Director
END
I wrote the following early this morning at the onset of AEM trading on NY with AEM down around $1.12
Agnico Eagle beats the street by 2 cents. It also increases production guidance for both 2018 and 2019 and most importantly adds dramatically to its reserves to 20.6 million oz/
In times past, the most important part of the earnings report for major mining companies is not the income side of things but the reserves and the future production and costs. The street (the bankers) focused on current income instead of what is coming in the future.
The smart guys came in and pushed the stock to a positive gain
xxxxxxxxxxxxxxxxxxxxxxxxxxxxxxxxxxxxxxxxxxxxxxxxxxxxxxxxxx
Your early THURSDAY morning currency, Asian stock market results, important USA/Asian currency crosses, gold/silver pricing overnight along with the price of oil Major stories overnight/9 AM EST
i) Chinese yuan vs USA dollar/CLOSED UP AT 6.3444 /shanghai bourse CLOSED / HANG SANG CLOSED UP 599.83 POINTS OR 1.97%
2. Nikkei closed UP 310,81 POINTS OR 1.47% /USA: YEN FALLS TO 106.76/DEADLY AS YEN CARRY TRADERS DISINTEGRATE
3. Europe stocks OPENED DEEPLY IN THE GREEN /USA dollar index FALLS TO 88.81/Euro RISES TO 1.2469
3b Japan 10 year bond yield: RISES TO . +.067/ !!!!(Japan buying 100% of bond issuance)/Japanese yen vs usa cross now at 106.76/ THIS IS TROUBLESOME AS BANK OF JAPAN IS RUNNING OUT OF BONDS TO BUY./JAPAN 10 YR YIELD FINALLY IN THE POSITIVE/BANK OF JAPAN LOSING CONTROL OF THEIR YIELD CURVE AS THEY PURCHASE ALL BONDS TO GET TO ZERO RATE!!
3c Nikkei now JUST BELOW 17,000
3d USA/Yen rate now well below the important 120 barrier this morning
3e WTI:: 60.58 and Brent: 63.58
3f Gold DOWN/Yen DOWN
3g Japan is to buy the equivalent of 108 billion uSA dollars worth of bond per month or $1.3 trillion. Japan’s GDP equals 5 trillion usa./“HELICOPTER MONEY” OFF THE TABLE FOR NOW /REVERSE OPERATION TWIST ON THE BONDS: PURCHASE OF LONG BONDS AND SELLING THE SHORT END
Japan to buy 100% of all new Japanese debt and by 2018 they will have 25% of all Japanese debt. Fifty percent of Japanese budget financed with debt.
3h Oil UP for WTI and UP FOR Brent this morning
3i European bond buying continues to push yields lower on all fronts in the EMU. German 10yr bund RISES TO +.789%/Italian 10 yr bond yield UP to 2.078% /SPAIN 10 YR BOND YIELD UP TO 1.520%
3j Greek 10 year bond yield FALLS TO : 4.37?????????????????
3k Gold at $1349.80 silver at:16.83 7 am est) SILVER NEXT RESISTANCE LEVEL AT $18.50
3l USA vs Russian rouble; (Russian rouble UP 14/100 in roubles/dollar) 56.87
3m oil into the 60 dollar handle for WTI and 63 handle for Brent/
3n Higher foreign deposits out of China sees huge risk of outflows and a currency depreciation. This can spell financial disaster for the rest of the world/
JAPAN ON JAN 29.2016 INITIATES NIRP. THIS MORNING THEY SIGNAL THEY MAY END NIRP. TODAY THE USA/YEN TRADES TO 106.76 DESTROYING JAPANESE CITIZENS WITH HIGHER FOOD INFLATION
30 SNB (Swiss National Bank) still intervening again in the markets driving down the SF. It is not working: USA/SF this morning 0.9250 as the Swiss Franc is still rising against most currencies. Euro vs SF is 1.1534 well above the floor set by the Swiss Finance Minister. Thomas Jordan, chief of the Swiss National Bank continues to purchase euros trying to lower value of the Swiss Franc.
3p BRITAIN VOTES AFFIRMATIVE BREXIT/LOWER PARLIAMENT APPROVES BREXIT COMMENCEMENT/ARTICLE 50 COMMENCES MARCH 29/2017
3r the 10 Year German bund now POSITIVE territory with the 10 year RISING to +0.789%
The bank withdrawals were causing massive hardship to the Greek bank. the Greek referendum voted overwhelming “NO”. Next step for Greece will be the recapitalization of the banks and that will be difficult.
4. USA 10 year treasury bond at 2.9333% early this morning (THIS IS DEADLY TO ALL MARKETS). Thirty year rate at 3.186% /BOTH VERY DEADLY
5. Details Ransquawk, Bloomberg, Deutsche bank/Jim Reid.
(courtesy Jim Reid/Bloomberg/Deutsche bank/zero hedge)
Global Stocks, S&P Futures Soar, Ignoring Yields Creeping Ever Closer To 3.00%
Profile picture for user Tyler Durden
by Tyler Durden
Thu, 02/15/2018 – 07:02
10
SHARES
Global stocks, bond yields and commodities all jumped higher on Thursday while the dollar plunge continued, as investors suddenly seemed to forget the inflation fears blamed for a brutal market sell-off in recent weeks.
Last week’s volocaust is a fading, distant memory, and this morning global stocks – albeit without China which is on weekly holiday for the Lunar New Year – continue their relentless surge with the Dow set to open back over 25,000, even as yields rise and the 10Y is fast approaching 3.00%, thanks to a plunging dollar which fell for a firth day, keeping financial condition well lubricated. As a result, global stocks and futures are a sea of green this morning despite growing inflationary noise in the background.

Commenting on the overnight price action, one major bank said it can be briefly summarized as: bearish USD, bearish fixed income, bullish equities, bullish oil. As the trader notes, “We’ve definitely been here before – in fact, it was the consensus trade for 2018 until the recent market rout questioned the move.” Therefore there’s certainly a sense of déjà vu as the paradoxical moves in markets continue at least until inflation fears hit the next tipping point and launch the next equity market selloff.
In the meantime, one can scratch their heads: the bank adds that “the bewildering nature of recent price action has become a somewhat familiar feature of markets lately.”
One needs just three charts to understand what is going on on most days: futures are up, as they are this morning…

… even if yields are sharply higher, which they also are as the 10Y rises above 2.93%…
… as long as the dollar is tumbling, and financial conditions are looser.

As Reuters notes, economists were struggling to explain the turnaround except for the argument that historically it’s not unusual for stocks and bond market borrowing costs to rise in tandem with a rapidly expanding economy.
Some just blamed the weather and time of year. They speculated that strong U.S. inflation data on Wednesday that many had predicted could reignite the rout was probably distorted. They also said the looming Chinese New Year may have caused Asian traders to square up.
Meanwhile, bond traders increased their expectations for the number of Federal Reserve interest-rate hikes to four by the end of next year after yesterday’s blistering CPI report. The inflation figures gave rise to debate among investors and traders on the breakdown in correlations to interest rates, as currency investors focused instead on the U.S.’s twin deficits.
“For me it’s a clear indication that inflation is not as big a threat as people made it out to be over the past couple of weeks,” said Lukas Daalder, chief investment officer at Robeco in Rotterdam. “The trend behind the market is still very strongly pointed upwards. 2017 was a very momentum-driven market, and if that’s still the case, which after yesterday it appears to be, then we will probably see new highs before too long.”
Volatility shrank back rapidly too. The VIX index fell all the way back to 18, less than half the 50-point peak touched last week.
* * *
Whatever the reason, the animal spirits were back. However, should the dollar and yields rise at the same time, run.
For now, China is off to enjoy the Lunar New Year and welcome the Year of the Dog, and there’s another celebration in EM FX as the ZAR continues to revel in the resignation of Zuma.
The Stoxx Europe 600 Index took its cue from a rally in the truncated Asian session, to advance for a second day – ignoring the growing, $22 billion Bridgewater short of European stocks – as traders assessed earnings from heavyweights including Nestle and Airbus while eyeing rising bond yields that may be approaching a critical level for the direction of equity markets.
As a result, the Stoxx 600 climbed 0.4%, heading for a weekly gain of ~2%. Airbus advanced 8.9% in the best performance among single stocks on the gauge after the planemaker struck an optimistic tone in its outlook for 2018, promising earnings growth of 20%. Nestle dropped 2.6% after it posted the weakest sales growth in more than 20 years. Elsewhere, South African exposed Old Mutual (+3.8%) and Anglo American (+3.0%) lead the FTSE 100 as South Africa now eyes life-after Zuma with Ramaphosa now appointed as Preisdent. Miners occupy a bulk of the other outperformers in the UK amid movements in the commodity complex with Antofagasta (+2.9%) also lifted after winning approval for a USD 1.1bln revamp of its Los Pelambres copper mine.
In Asia, Australia’s ASX 200 (+1.2%) was positive with its biggest movers dictated by earnings releases and as commodity names were underpinned by strength in the complex. Elsewhere, Nikkei 225 (+1.5%) advanced and managed to ignore the latest plunge in the USDJPY, which took out downside stops after Finance Minister Taro Aso said the currency’s strength isn’t abrupt enough to require intervention– as well as a slump in machine orders, while Hang Seng (+1.6%) closed the session as the outperformer in a holiday-shortened session, before it joined mainland China for Lunar New Year celebrations.
In FX, it was all about the ongoing dollar weakness, which persisted pushing the Bloomberg Dollar Index down a fifth day. The dollar tumbled though across the board, including to a 15-month low against the yen of 106.18 yen as worries about the U.S. government’s finances seemed to set again after a White House-led spending splurge and recent corporate tax cuts. That also marked a drop of 3.8 percent from its early February peak near 110.50 yen, while the euro and pound both climbed back above the $1.25 and $1.40 thresholds.
“The story I hear most frequently from people is it’s the re-emergence of the twin deficits,” said RBC Capital Markets head of currency strategy Adam Cole, in London, of the dollar’s persistent weakness. “There seem to be concerns on the U.S. fiscal position and what that implies for the current account.”
The EUR/USD climbed a fifth day, approaching Jan. 25 high of 1.2537, which was the highest since Dec. 2014, while GBP/USD sustains advance over 1.40 on reports of the EU’s softening Brexit stance, set for fourth daily rise. As noted above, the USD/JPY slipped; the yen earlier touched its strongest level since Nov. 2016 versus the dollar on comments from the finance minister dismissing the need for intervention. The South African rand was the biggest gainer versus the dollar among its major peers on news of Jacob Zuma’s resignation; the rand appreciated to its strongest level since Feb. 2015.
Looking at the ongoing Brexit drama, UK PM May is reportedly facing a crisis related to the Brexit border deal, after Northern Ireland power sharing discussions were said to have collapsed. Separately the Telegraph reported that the EU will demand the right to raid financial services firms in Britain after Brexit and hand its regulators sweeping new powers, as Brussels moves to shackle the City of London with red tape after the UK leaves the bloc. Finally, in some good news, the BBC reported that EU diplomats have removed a so-called “punishment clause” from a draft text of the arrangement for the Brexit transition period, the BBC understands. However, it was later reported that the EU denied this was the case…
In the commodities complex, WTI and Brent crude futures trade in close proximity to recent highs seen in the wake of yesterday’ssmaller than expected build in the DoEs and comments from Saudi with prices also supported by the broad softness in the USD. Inmetals, gold prices have also benefitted from the softer USD, although gains are likely capped by the broad-based risk sentiment inthe market. Elsewhere, copper prices have hit their highest level in 10 days amid this morning’s risk environment, while priceaction was relatively limited during Asia-Pac trade given the closure of the Shanghai Futures Exchange for the Lunar New Year holiday.
Market Snapshot
S&P 500 futures up 0.8% to 2,718.50
STOXX Europe 600 up 0.8% to 377.54
MSCI Asia Pacific up 1.4% to 176.14
MSCI Asia Pacific ex Japan up 1.3% to 578.63
Nikkei up 1.5% to 21,464.98
Topix up 1% to 1,719.27
Hang Seng Index up 2% to 31,115.43
Shanghai Composite up 0.5% to 3,199.16
Sensex up 0.4% to 34,273.84
Australia S&P/ASX 200 up 1.2% to 5,908.99
Kospi up 1.1% to 2,421.83
German 10Y yield rose 2.4 bps to 0.781%
Euro up 0.3% to $1.2492
Italian 10Y yield fell 2.0 bps to 1.795%
Spanish 10Y yield rose 0.6 bps to 1.52%
Brent futures up 0.2% to $64.49/bbl
Gold spot up 0.3% to $1,354.33
U.S. Dollar Index down 0.4% to 88.76
Top Overnight News from Bloomberg
Cyril Ramaphosa faces a tough road ahead as South Africa’s new president after Jacob Zuma’s resignation late Wednesday ended nine years of his scandal-marred administration. Ramaphosa remains acting president until his expected election in parliament later Thursday
U.S. tax authorities have requested documents from lenders and investors in real estate projects managed by Jared Kushner’s family, according to a person familiar with the matter.
Japanese Finance Minister Aso said the yen’s recent move isn’t abrupt enough to warrant intervention causing the yen to climb
A report from Politico that the European Union is looking to ease Brexit transition conditions, helped support the pound
Merkel vows to ensure Germany maintains balanced budget
Japan’s Aso says yen strength isn’t abrupt enough now to intervene
Kuroda says BOJ will continue to take best policy for price target
Australia Jan jobs 16.0k vs 15.0k est; unempl. rate 5.5% vs 5.5% est
Singapore Jan exports -0.3% vs 4.2% est; y/y 13.0% vs 8.9% est
Asian stocks traded higher as the region received a tailwind from US where all major indices finished with firm gains and the DJIA posted its best 4-day performance in almost a decade. ASX 200 (+1.2%) was positive with its biggest movers dictated by earnings releases and as commodity names were underpinned by strength in the complex. Elsewhere, Nikkei 225 (+1.5%) advanced and managed to overlook a firmer JPY and slump in machine orders, while Hang Seng (+1.6%) closed the session as the outperformer in a holiday-shortened session, before it joined its mainland counterparts for Lunar New Year celebrations. Finally, 10yr JGBs were relatively flat with early mild pressure seen amid the uptick in riskier assets, although this was later counterbalanced amid the BoJ’s presence in the market for 1yr-10yr JGBs totalling over JPY 1tln.
Top Asian News
Philippine Central Bank Cuts Reserve Ratio by 1 Point to 19%
Abe Said to Be Likely to Nominate BOJ Governor on Friday
IDG-Backed China Online Credit-Checking Firm Is Said to Plan IPO
Cathay Pacific Supplier Topcast Aviation Is Said to Pursue Sale
European bourses trade higher across the board (Eurostoxx 50 +0.6%) in a continuation of the sentiment seen yesterday on Wall Street and overnight in Asia-Pac trade. On a sector basis, consumer staples underperform following lacklustre earnings from Swiss-titan Nestle (-2.2%), with the index heavyweight subsequently leading the SMI to lag its peers in the region. Elsewhere, South African exposed Old Mutual (+3.8%) and Anglo American (+3.0%) lead the FTSE 100 as South Africa now eyes life-after Zuma with Ramaphosa now appointed as Preisdent. Miners occupy a bulk of the other outperformers in the UK amid movements in the commodity complex with Antofagasta (+2.9%) also lifted after winning approval for a USD 1.1bln revamp of its Los Pelambres copper mine. Elsewhere, Standard Life (-4.9%) sits at the bottom of the FSTE 100 after Scottish Widows and Lloyds sent notices to co. to terminate investment management relations. Finally, earnings dominate the state of play in the CAC with Airbus (+9.3%), Schneider Electric (+3.6%) and CapGemini (+2.5%) all lifted by encouraging earnings.
Top European news
Dalio Causes Stir With $18 Billion Surge in European Short Bets
Austrian Bitcoin Scam May Affect Over 10,000 Users, Presse Says
In the Age of Brexit, Events Manager RELX Opts for London Base
In FX, Japan’s Finance Minister Aso has given the green light for Jpy bulls to charge on, and 106.00 vs the Usd is now within striking distance given little in the way of technical support until 105.85 vs the latest 106.20 low. Moreover, all other G10 rivals are eyeing recent peaks vs the Greenback with Cable just eclipsing the 1.4067 level posted after the BoE’s hawkish policy guidance shift on February 8th, while Eur/Usd almost challenged Fib resistance at 1.2518 ahead of the 1.2537 year to date high before slipping back below 1.2500. Usd/Chf is toppy around the bottom of a 0.9300-0.9230 range, while Nzd/Usd has rebounded above the 0.7400 handle and Aud/Usd is over 0.7950 despite mixed jobs data overnight and ahead of RBA Governor Lowe orates later today. Usd/Cad relatively steady albeit sharply down from Wednesday’s post-US CPI data spike highs and sub-1.2500 amidst ongoing NAFTA uncertainty and awaiting a speech from BoC Deputy Governor Schembri. All this leaves the Dollar Index below 89.00 again and vulnerable against a deeper set-back towards 2018 lows under 88.50, especially as the Usd continues to suffer broader losses with the likes of Usd/Zar sliding towards 11.6400 in wake of the resignation of Zuma as SA President with immediate effect.
In the commodities complex, WTI and Brent crude futures trade in close proximity to recent highs seen in the wake of yesterday’s smaller than expected build in the DoEs and comments from Saudi with prices also supported by the broad softness in the USD. In metals, gold prices have also benefitted from the softer USD, although gains are likely capped by the broad-based risk sentiment in the market. Elsewhere, copper prices have hit their highest level in 10 days amid this morning’s risk environment, while price action was relatively limited during Asia-Pac trade given the closure of the Shanghai Futures Exchange for the Lunar New Year holiday.
Looking at the day ahead, the January PPI and IP, February empire manufacturing, February Philly Fed PMI, February NAHB housing market index and the latest weekly initial jobless claims readings are all due in the US. In Europe Q4 employment data in France and the December trade balance for the Euro area are due. The ECB’s Mersch and Praet are also slated to speak at an event in Paris.
US Event Calendar
8:30am: Empire Manufacturing, est. 18, prior 17.7
8:30am: Initial Jobless Claims, est. 228,000, prior 221,000; Continuing Claims, est. 1.93m, prior 1.92m
8:30am: PPI Final Demand MoM, est. 0.4%, prior -0.1%; Ex Food and Energy MoM, est. 0.2%, prior -0.1%
8:30am: PPI Final Demand YoY, est. 2.4%, prior 2.6%; Ex Food and Energy YoY, est. 2.0%, prior 2.3%
8:30am: Philadelphia Fed Business Outlook, est. 21.6, prior 22.2
9:15am: Industrial Production MoM, est. 0.2%, prior 0.9%; Manufacturing (SIC) Production, est. 0.25%, prior 0.1%
10am: NAHB Housing Market Index, est. 72, prior 72
4pm: Total Net TIC Flows, prior $33.8b; Net Long-term TIC Flows, prior $57.5b
DB’s Jim Reid concludes the overnight wrap
Happy Boxing Valentine’s Day. My wife went to bed at 7pm last night with the twins to desperately try to catch up on sleep while I watched a rampant Liverpool win 5-0 away from home in Europe on the telly, with Bloomberg TV on my iPad alongside me to catch up with the post CPI rally. A question for long time married readers though is when does romance come back into a marriage after having children?
Anyway yesterday was one of those days where having the most important data release ahead of time probably wouldn’t have helped you much. In fact it may have helped you lose money in risk. The well above expectations number for CPI was negative for bonds – as you would have expected – but equities rallied hard (S&P 500 +1.34%) after a large sell off in the minutes following the release (S&P futures slumped c.-1.8%). The price action yesterday perhaps tells us that the normalisation from last week’s vol shock is more powerful for markets for now than the data. However if this inflation trend holds (as has been and still is our expectation) we’re in for some real fun and games in markets in 2018 once the dust settles.
To be fair, weaker US retail sales (more details later) may have confused the story somewhat but it was all about inflation. For core, once we added in the extra decimal places the number came in at +0.349% putting clear air over the consensus estimate for just +0.2% and nearly rounding up to 0.4% MoM. In fact that was the largest monthly climb since March 2005 and kept the YoY steady at +1.8% (+1.7% expected). The three-month annualized rate also jumped to the highest since 2011 (+2.9%) and the six-month annualized rate also hit the highest since 2008 (+2.6%). The underlying components appeared to also affirm that inflation was relatively broad-based while there was a similar beat at the headline level (+0.5% mom vs. +0.3% expected).
Treasury yields marched higher with 10 year yields +7.3bp higher on the day to 2.903%, but c9bp up from just before the release. 2 and 30yr yields were up 6.1 and 5.1bps on the day. A reminder that yesterday we published a note (link) showing asset prices in the first and second half of the 1960s using our economists’ framework that there are big similarities between the inflection point on inflation in the 1960s and the current day.
In terms of US equities, sectors such as Banks (+2.55%), tech (+1.95%) and energy (+1.40%) led the rally. The VIX also swung c7pts intraday to close 5.7pts lower at 19.26. As we said earlier perhaps this current vol normalisation trend held sway yesterday but if inflation continues like this it feels impossible for us to imagine vol settling back down around 10 for a persistent period. We are likely to have some big trading days this year.
This morning in Asia, markets are extending on the positive US lead. The Nikkei (+1.21%) and Hang Seng (+1.97%) are up as we type, while the Chinese markets are now closed until the 21st for the lunar New Year holidays. After the bell in the US, Cisco’s share price jumped c7% after guiding to higher than expected sales for the current quarter and plans to boost its share buybacks by $25bn. Elsewhere, the YEN rose for the fourth straight day (+0.4%), partly helped by Japan’s Finance minister Aso prior comments where he noted “the current situation doesn’t warrant special intervention. The Yen isn’t rising or falling abruptly”.
Now recapping other markets performance from yesterday. European bourses initially traded lower post the US CPI print, but recovered throughout the day to be up c1%, partly aided by sound corporate results and supportive GDP prints. The Stoxx 600 (+1.07%), DAX (+1.17%) and FTSE (+0.64%) were all up and only the energy sector was in the red within the Stoxx. The VSTOXX fell 20% to 20.71. Over in government bonds, 10y Bunds and Gilts yields rose 0.7bp and 2.1bp respectively, while peripherals partly recovered from the prior day losses with yields down 1-6bp. Turning to currencies, the US dollar index weakened for the third consecutive day (-0.65%), while both the Euro and Sterling gained c0.8%. Elsewhere, the South African Rand was up 2.1% following President Zuma’s resignation. In commodities, WTI oil rebounded 2.38% to $60.60/bbl, in part as the latest EIA report showed US crude stockpiles rose less than expected last week. Precious metals gained c1.6% (Gold +1.59%; Silver +1.67%) and other LME base metals increased as the USD continues to fall (Copper +2.50%; Zinc +2.80%; Aluminium +1.80%).
Away from the markets, President Trump said he supports a 25c per gallon increase in federal gasoline and diesel taxes to help pay for upgrading roads, bridges and other public works. So perhaps there is more potential to fund his $1.5bln infrastructure plans, although Republican Senator Grassley noted the tax hike was unlikely to come up for a vote in the Senate and that “he’ll never get it by (Senator) McConnell”.
Staying in the US, our economists have been highlighting the upside risks to their growth outlook for some time. Given the recent passage of a bipartisan budget agreement provides for c$300 billion in additional discretionary spending over the next two years, they have now raised their 2018 real GDP growth forecast (Q4/Q4) to 2.9% (+0.3ppt) and the 2019 forecast rises to 2.5% (+0.4ppt). Following on, stronger growth should put further downward pressure on the unemployment rate, which they now expect will trough at 3.2% in 2019, about 1.5ppt below NAIRU. On rates, their views are unchanged and they continue to expect four rate hikes this year and three next year. But recent developments have tilted the balance of risks to the upside.
Now turning to some of the Brexit headlines. Foreign secretary Boris Johnson seemed to support the status quo during the Brexit transition period by noting “things will remain as they are”. However, he does make a case for a clean break with the EU – leaving the single market and customs union and pursuing flexibility for the UK to choose which EU rules it wants to keep post Brexit. Elsewhere, he noted “Theresa” was the right PM for the UK to lead Brexit talks while also indicating “let’s not go there” in terms of a potential second referendum on Brexit. On the other side, the EC’s Juncker’s response was quite colourful, he noted some in British politics “are against the truth, pretending that I’m a stupid, stubborn federalist…that I’m in favour of the EU superstate”, but “I’m strictly against (a superstate)….we aren’t the United States of America, we are the EU…”.
In Germany, Ms Merkel reiterated that the “black zero” fiscal prudence is the trademark of the CDU and “it will remain so in the future”. She noted that “if the SPD occupy the Finance Ministry in the future, our budget lawmakers will have to be even more careful that they don’t pile on new debt”.
Before we take a look at today’s calendar, we wrap up with other data releases from yesterday. In the US, the core CPI for January was above market at 0.3% mom (vs. 0.2%) as discussed earlier. Price increases were well spread across the core CPI, but part of the CPI gain was from a 1.7% monthly increase in apparel prices, the biggest increase since 1990. Notably, retail sales missed expectations. In the details, headline retail sales was -0.3% mom (vs. +0.2% expected). Ex auto and gas sales (-0.2% mom vs. +0.3%) and control group sales (0.0% mom vs. +0.4% expected) were also accompanied by downward revisions to December sales. The data certainly suggested a weaker looking consumption profile to the start the year and will likely cause the street to reassess growth forecasts the current quarter. Indeed the Atlanta Fed slashed their Q1 forecast to 3.25% from 4% but be slightly careful as their could have been some post hurricanes payback here. Elsewhere, December business inventories slightly beat at 0.4% mom (vs. 0.3% expected).
The Euro area’s 4Q GDP was in line at 0.6% qoq and 2.7% yoy. Across the countries, Germany’s 4Q GDP was also in line and solid at 0.6% qoq while Italy was slightly lower than expected at 0.3% qoq (vs. 0.4%). Elsewhere, the Euro area’s December IP was above market at 0.4% mom (vs. 0.1%), while Germany’s final reading of the January CPI was unrevised at 1.4% yoy. In Sweden the Riksbank left its policy rate at -0.5% and continued to forecast a gradual tightening from the second half of this year.
Looking at the day ahead, the January PPI and IP, February empire manufacturing, February Philly Fed PMI, February NAHB housing market index and the latest weekly initial jobless claims readings are all due in the US. In Europe Q4 employment data in France and the December trade balance for the Euro area are due. The ECB’s Mersch and Praet are also slated to speak at an event in Paris. Nestle will report earnings.
xxxxxxxxxxxxxxxxxxxxxxxxxxxxxxxxxxxxxxxxxxxxxxxxxxxxxxxxxxx
Pics Of The Day


xxxxxxxxxxxxxxxxxxxxxxxxxxxxxxxxxxxxxxxxxxxxxxxxxxxxxxxxxxxxxxxxxx
Thank You Harvey Honored To Post Your Work Man !
https://www.silverdoctors.com/tag/harvey-organ/
xxxxxxxxxxxxxxxxxxxxxxxxxxxxxxxxxxxxxxxxxxxxxxxxxxxxxxxxxxx
Thank You Jesse http://jessescrossroadscafe.blogspot.com/
xxxxxxxxxxxxxxxxxxxxxxxxxxxxxxxxxxxxxxxxxxxxxxxxxxxxxxxxxxx
Thank You GATA http://www.gata.org/
xxxxxxxxxxxxxxxxxxxxxxxxxxxxxxxxxxxxxxxxxxxxxxxxxxxxxxxxxxx
Thank You from MMgys The Love Network <3
xxxxxxxxxxxxxxxxxxxxxxxxxxxxxxxxxxxxxxxxxxxxxxxxxxxxxxxxxxx
Visit our Friends at GOLDBUGS INDEX https://investorshub.advfn.com/GOLDBUGS-Gold-Spot-(FOREX-XAUUSDO)-COM-GC-Z15-3386/
xxxxxxxxxxxxxxxxxxxxxxxxxxxxxxxxxxxxxxxxxxxxxxxxxxxxxxxxxxx
and Thank You All for Being With Us Tonight
Hoping You Have Nice Blue Sky Friday <3
MMgys
xxxxxxxxxxxxxxxxxxxxxxxxxxxxxxxxxxxxxxxxxxxxxxxxxxxxxxxx
Tucson Gem & Mineral Show (Last Week)
Worlds Largest Gem Show! Tucson Gem Show 2018
https://www.youtube.com/watch?v=xKpeJLjLXe4
http://www.tgms.org/calendar/2017/10/17/tucson-gem-mineral-society-present
.jpg)
Good Morning Ladies and Gentlemen
~Welcome To :
~*~Mining & Metals Du Jour~*~ Graveyard Shift~
Always a Pleasure To Have You With Us
MMgys
ELO & Allman Brothers Taking Us Into The Weekend
and The Forecast Is "Blue Skies"
OK Here We Go >>>>>>>>>>>>>>>>>>
Onwards To The Data
xxxxxxxxxxxxxxxxxxxxxxxxxxxxxxxxxxxxxxxxxxxxxxxxxxxxxxxxxxxx
There Will Be No Economic Boom
Written by Lance Roberts | Feb, 15, 2018

Last week, Congress passed a 2-year “continuing resolution, or C.R.,” to keep the Government funded through the 2018 elections. While “fiscal conservatism” was just placed on the sacrificial alter to satisfy the “Re-election” Gods,” the bigger issue is the impact to the economy and, ultimately, the financial markets.
The passage of the $400 billion C.R. has an impact that few people understand. When a C.R. is passed it keeps Government spending at the same previous baseline PLUS an 8% increase. The recent C.R. just added $200 billion per year to that baseline. This means over the next decade, the C.R. will add $2 Trillion in spending to the Federal budget. Then add to that any other spending approved such as the proposed $200 billion for an infrastructure spending bill, money for DACA/Immigration reform, or a whole host of other social welfare programs that will require additional funding.
But that is only half the problem. The recent passage of tax reform will trim roughly $2 Trillion from revenues over the next decade as well.
This is easy math.
Cut $2 trillion in revenue, add $2 trillion in spending, and you create a $4 trillion dollar gap in the budget. Of course, that is $4 Trillion in addition to the current run rate in spending which continues the current acceleration of the “debt problem.”

But it gets worse.
As Oxford Economics reported via Zerohedge:
“The tax cuts passed late last year, combined with the spending bill Congress passed last week, will push deficits sharply higher. Furthermore, Trump’s own budget anticipates that US debt will hit $30 trillion by 2028: an increase of $10 trillion.”
Oxford is right. In order to “pay for” all of the proposed spending, at a time when the government will receive less revenue in the form of tax collections, the difference will be funded through debt issuance.
Simon Black recently penned an interesting note on this:
“Less than two weeks ago, the United States Department of Treasury very quietly released its own internal projections for the federal government’s budget deficits over the next several years. And the numbers are pretty gruesome.
In order to plug the gaps from its soaring deficits, the Treasury Department expects to borrow nearly $1 trillion this fiscal year. Then nearly $1.1 trillion next fiscal year. And up to $1.3 trillion the year after that.
This means that the national debt will exceed $25 trillion by September 30, 2020.”

Of course, “fiscal responsibility” left Washington a long time ago, so, what’s another $10 Trillion at this point?

While this issue is not lost on a vast majority of Americans that “choose” to pay attention, it has been quickly dismissed by much of the mainstream media, and Congressman running for re-election, by suggesting tax reform will significantly boost economic growth over the next decade. The general statement has been:
“By passing much-needed tax reform, we will finally unleash the economic growth engine which will more than pay for these tax cuts in the future.”
Don’t dismiss the importance of $25-30 Trillion in U.S. debt. It is larger than the debts of every other nation in the world – combined.
Congress Killed The Economic Boom
While it truly is a great “talking point,” the reality is it just isn’t true.
As I have shown previously, there is absolutely NO historical evidence that cutting taxes, without offsetting cuts to spending, leads to stronger economic growth.

Even Congressman Kevin Brady, Chairman of the House Ways and Means Committee, confirmed the same.
Deficits, and deficit spending, are HIGHLY destructive to economic growth as it directly impacts gross receipts and saved capital equally. Like cancer – running deficits, along with continued deficit spending, continues to destroy saved capital and damages capital formation.
Debt is, by its very nature, a cancer on economic growth. As debt levels rise it consumes more capital by diverting it from productive investments into debt service. As debt levels spread through the system it consumes greater amounts of capital until it eventually kills the host. The chart below shows the rise of federal debt and its impact on economic growth.

The reality is that the majority of the aggregate growth in the economy since 1980 has been financed by deficit spending, credit creation and a reduction in savings. This reduced productive investment in the economy and the output of the economy slowed. As the economy slowed, and wages fell, the consumer was forced to take on more leverage to maintain their standard of living which in turn decreased savings. As a result of the increased leverage more of their income was needed to service the debt – and with that, the “debt cancer” engulfed the system.
The Austrian business cycle theory attempts to explain business cycles through a set of ideas. The theory views business cycles:
“As the inevitable consequence of excessive growth in bank credit, exacerbated by inherently damaging and ineffective central bank policies, which cause interest rates to remain too low for too long, resulting in excessive credit creation, speculative economic bubbles and lowered savings.”

The problem that is yet not recognized by the current Administration and mainstream economists is that the excessive deficits and exponential credit creation can no longer be sustained. The process of a “credit contraction” will eventually occur over a long period of time as consumers and governments are ultimately forced to deal with the deficits.
The good news is the process of “clearing” the market will eventually allow resources to be reallocated back towards more efficient uses and the economy will begin to grow again at more sustainable and organic rates.
Today, however, expectations of a return to economic growth rates of the past are most likely just a fairy tale. The past 9-years of stock market returns have been fueled by trillions of dollars of support and direct injections into the financial system – that support is not sustainable in the long run. While the injections have kept the economy from falling into a depression in the short term –
There is no way to achieve the necessary goals “pain-free.” The time to implement austerity measures is when the economy is running a budget surplus and is close to full employment. That time was two Administrations ago when the economy would have slowed but could have absorbed and adjusted to the restrictive measures. However, when things are good, no one wants to “fix what isn’t broken”. The problem today is that with a high dependency on government support, high levels of underemployment and rising budget deficits, the implementation of austerity measures will only deter future economic growth, which is dependent on the very things that need to be “fixed”.
The processes that fueled the economic growth over the last 30 years are now beginning to run in reverse, and when combined with the demographic shifts in the U.S., the impact could be far more immediate and prolonged than the media, economists, and analysts are currently expecting. Sacrifices will have to be made, the economy will drag on at subpar rates of growth, individuals will be working far longer into their retirement years and the next generation of Americans will lead a far different life than what the currently retiring generation enjoyed.
It is simply a function of the math.
Lance Roberts
end
xxxxxxxxxxxxxxxxxxxxxxxxxxxxxxxxxxxxxxxxxxxxxxxxxxxxxxxxxxx
Feb 15/GOLD DOWN $2.45 TO $1352.95/SILVER DOWN 8 CENTS TO $16.84/HUGE EFP TRANSFER IN GOLD OF 22,672 CONTRACTS/SILVER EFP ISSUANCE: 1731 CONTRACTS/THE KEY USA/YEN CROSS PLUMMETS TO CLOSE TO 106.00/TWO BIG USA DATA POINTS TODAY; PPI IS SCORCHING HOT AND THAT MEANS INFLATION AROUND THE CORNER/INDUSTRIAL PRODUCTION FALTERS MEANING STAGFLATION MAY BE UPON US/MORE SWAMP STORIES FOR YOU TONIGHT/
February 15, 2018 · by harveyorgan · in Uncat
GOLD: $1352.95 DOWN $2.45
Silver: $16.84 DOWN 8 cents
Closing access prices:
Gold $1353.50
silver: $16.88
SHANGHAI GOLD FIX: FIRST FIX 10 15 PM EST (2:15 SHANGHAI LOCAL TIME)
SECOND FIX: 2:15 AM EST (6:15 SHANGHAI LOCAL TIME)
SHANGHAI FIRST GOLD FIX: $XXXX DOLLARS PER OZ
NY PRICE OF GOLD AT EXACT SAME TIME: $XXXX
PREMIUM FIRST FIX: $3.78
xxxxxxxxxxxxxxxxxxxxxxxxxxxxxxxxxxxxxxxxxxxxxx
SECOND SHANGHAI GOLD FIX: $XXXX
NY GOLD PRICE AT THE EXACT SAME TIME: $1333.50
discount of Shanghai 2nd fix/NY:$1.20
xxxxxxxxxxxxxxxxxxxxxxxxxxxxxxxxxxxxxxxxxxxxxxxxxxx
LONDON FIRST GOLD FIX: 5:30 am est $1353.70
NY PRICING AT THE EXACT SAME TIME: $1353.90
LONDON SECOND GOLD FIX 10 AM: $1352.45
NY PRICING AT THE EXACT SAME TIME. $1351.900
For comex gold:
FEBRUARY/
NUMBER OF NOTICES FILED TODAY FOR FEBRUARY CONTRACT: 1 NOTICE(S) FOR 100 OZ.
TOTAL NOTICES SO FAR:1784 FOR 178400 OZ (5.5489 TONNES),
For silver:
FEBRUARY
1 NOTICE(S) FILED TODAY FOR
5,000 OZ/
Total number of notices filed so far this month: 308 for 1,540,000 oz
XXXXXXXXXXXXXXXXXXXXXXXXXXXXXX
Bitcoin: BID $9638/OFFER $9714: up $198(morning)
Bitcoin: BID/ $99029/offer $9999: up $492 (CLOSING/5 PM)
end
Let us have a look at the data for today\
xxxxxxxxxxxxxxxxxxxxxxxxxxxxxxxxxxxxxxxxxxxxxxxxxxxxxxxxxxxxxxxxxxxxxxxxxx
In silver, the total open interest ROSE BY A HUGE SIZED 3070 contracts from 194,056 RISING TO 197,126 WITH YESTERDAY’S HUGE 35 CENT GAIN IN SILVER PRICING. WE HAD ZERO COMEX LIQUIDATION. HOWEVER, WE WERE AGAIN NOTIFIED THAT WE HAD ANOTHER GOOD SIZED NUMBER OF COMEX LONGS TRANSFERRING THEIR CONTRACTS TO LONDON THROUGH THE EFP ROUTE: 1731 EFP’S FOR MARCH AND AND 0 EFP’S FOR MAY AND ZERO FOR ALL OTHER MONTHS AND THUS TOTAL ISSUANCE OF 1731 CONTRACTS. WITH THE TRANSFER OF 1731 CONTRACTS, WHAT THE CME IS STATING IS THAT THERE IS NO SILVER (OR GOLD) TO BE DELIVERED UPON AT THE COMEX AS THEY MUST EXPORT THEIR OBLIGATION TO LONDON. ALSO KEEP IN MIND THAT THERE CAN BE A DELAY OF 24 HRS IN THE ISSUING OF EFP’S. THE 1731 CONTRACTS TRANSLATES INTO 8.915 MILLION OZ DESPITE WITH THE CONTINUAL DROP IN OPEN INTEREST IN SILVER AT THE COMEX.
ACCUMULATION FOR EFP’S/SILVER/ STARTING FROM FIRST DAY NOTICE/FOR MONTH OF FEBRUARY:
36,852 CONTRACTS (FOR 12 TRADING DAYS TOTAL 36,852 CONTRACTS OR 184.26 MILLION OZ: AVERAGE PER DAY: 3071 CONTRACTS OR 15.355 MILLION OZ/DAY)
TO GIVE YOU AN IDEA AS TO THE HUGE SUPPLY THIS MONTH IN SILVER: SO FAR THIS MONTH: 184.26 MILLION PAPER OZ HAVE MORPHED OVER TO LONDON. THIS REPRESENTS AROUND 26/32% OF ANNUAL GLOBAL PRODUCTION
ACCUMULATION IN YEAR 2018 TO DATE SILVER EFP’S: 432.60 MILLION OZ.
ACCUMULATION FOR JAN 2018: 236.879 MILLION OZ
RESULT: A HUGE SIZED GAIN IN OI SILVER COMEX WITH THE HUGE 35 CENT GAIN IN SILVER PRICE. WE ALSO HAD A GOOD SIZED EFP ISSUANCE OF 1731 CONTRACTS WHICH EXITED OUT OF THE SILVER COMEX AND TRANSFERRED THEIR OI TO LONDON AS FORWARDS. SPECULATORS CONTINUED THEIR INTEREST IN ATTACKING THE SILVER COMEX FOR PHYSICAL SILVER . FROM THE CME DATA 1731 EFP’S FOR MONTHS MARCH AND MAY WERE ISSUED FOR TODAY FOR A DELIVERABLE FORWARD CONTRACT OVER IN LONDON WITH A FIAT BONUS. WE GAINED 4801 OI CONTRACTS i.e. 1731 open interest contracts headed for London (EFP’s) TOGETHER WITH A INCREASE OF 3070 OI COMEX CONTRACTS. AND ALL OF THIS HAPPENED WITH THE HUGE RISE IN PRICE OF SILVER OF 35 CENTS AND A CLOSING PRICE OF $16.92 WITH RESPECT TO YESTERDAY’S TRADING. YET WE STILL HAVE A FAIR AMOUNT OF SILVER STANDING AT THE COMEX.
In ounces AT THE COMEX, the OI is still represented by just UNDER 1 BILLION oz i.e. 0.986 BILLION TO BE EXACT or 141% of annual global silver production (ex Russia & ex China).
FOR THE NEW FRONT FEBRUARY MONTH/ THEY FILED: 1 NOTICE(S) FOR 5,000 OZ OF SILVER
In gold, the open interest ROSE BY A HUMONGOUS 16,637 CONTRACTS UP TO 528,382 WITH THE GIGANTIC SIZED RISE IN PRICE OF GOLD WITH YESTERDAY’S TRADING ($27.40). HOWEVER, IN ANOTHER DEVELOPMENT, WE RECEIVED THE TOTAL NUMBER OF GOLD EFP’S ISSUED FOR TODAY AND IT TOTALED AN ATMOSPHERIC SIZED 22,672 CONTRACTS OF WHICH APRIL SAW THE ISSUANCE OF 21,922 CONTRACTS AND JUNE SAW THE ISSUANCE OF 750 CONTRACTS AND THEN ALL OTHER MONTHS ZERO. The new OI for the gold complex rests at 528,382. ALSO REMEMBER THAT THERE WILL BE A DELAY IN THE ISSUANCE OF EFP’S. THE BANKERS REMOVE LONG POSITIONS OF COMEX GOLD IMMEDIATELY. THEN THEY ORCHESTRATE THEIR PRIVATE EFP DEAL WITH THE LONGS AND THAT COULD TAKE AN ADDITIONAL 48 HRS SO WE GENERALLY DO NOT GET A MATCH WITH RESPECT TO DEPARTING COMEX LONGS AND NEW EFP LONG TRANSFERS. DEMAND FOR GOLD INTENSIFIES GREATLY AS WE CONTINUE TO WITNESS A HUGE NUMBER OF EFP TRANSFERS TOGETHER WITH THE MASSIVE INCREASE IN GOLD COMEX OI TOGETHER WITH THE TOTAL AMOUNT OF GOLD OUNCES STANDING FOR FEBRUARY COMEX. EVEN THOUGH THE BANKERS ISSUED THESE MONSTROUS EFPS, THE OBLIGATION STILL RESTS WITH THE BANKERS TO SUPPLY METAL BUT IT TRANSFERS THE RISK TO A LONDON BANKER OBLIGATION AND NOT A NEW YORK COMEX OBLIGATION. LONGS RECEIVE A FIAT BONUS TOGETHER WITH A LONG LONDON FORWARD. THUS, BY THESE ACTIONS, THE BANKERS AT THE COMEX HAVE JUST STATED THAT THEY HAVE NO APPRECIABLE METAL!! THIS IS A MASSIVE FRAUD: THEY CANNOT SUPPLY ANY METAL TO OUR COMEX LONGS BUT THEY ARE QUITE WILLING TO SUPPLY MASSIVE NON BACKED GOLD (AND SILVER) PAPER KNOWING THAT THEY HAVE NO METAL TO SATISFY OUR LONGS. LONDON IS NOW SEVERELY BACKWARD IN BOTH GOLD AND SILVER (BIG RISE IN BOTH GOFO AND SIFO) AND WE ARE WITNESSING DELAYS IN ACTUAL DELIVERIES. IN ESSENCE TODAY DESPITE YESTERDAY’S TRADING IN GOLD, WE HAVE A GAIN OF 39,309 CONTRACTS: 16,637 OI CONTRACTS INCREASED AT THE COMEX AND A GIGANTIC SIZED 22,672 OI CONTRACTS WHICH NAVIGATED OVER TO LONDON.(39,309 oi gain in CONTRACTS EQUATES TO 122.26 TONNES)
YESTERDAY, WE HAD 6481 EFP’S ISSUED.
ACCUMULATION OF EFP’S/ GOLD(EXCHANGE FOR PHYSICAL) FOR THE MONTH OF FEBRUARY STARTING WITH FIRST DAY NOTICE: 131,430 CONTRACTS OR 13,143,000 OZ OR 408.80 TONNES (12 TRADING DAYS AND THUS AVERAGING: 10,952 EFP CONTRACTS PER TRADING DAY OR 1,095,200 OZ/ TRADING DAY)
TO GIVE YOU AN IDEA AS TO THE HUGE SIZE OF THESE EFP TRANSFERS : SO FAR THIS MONTH IN 12 TRADING DAYS: IN TONNES: 408.80 TONNES
TOTAL ANNUAL GOLD PRODUCTION, 2017, THROUGHOUT THE WORLD EX CHINA EX RUSSIA: 2200 TONNES
THUS EFP TRANSFERS REPRESENTS 408.80/2200 x 100% TONNES = 18.58% OF GLOBAL ANNUAL PRODUCTION SO FAR IN FEBRUARY ALONE.
ACCUMULATION OF GOLD EFP’S YEAR 2018 TO DATE: 1042.2 TONNES
ACCUMULATION OF GOLD EFP’S FOR JANUARY 2018: 653.22 TONNES
Result: A HUGE SIZED INCREASE IN OI AT THE COMEX WITH THE HUGE SIZED GAIN IN PRICE IN GOLD TRADING YESTERDAY ($27.40). IT IS WITHOUT A DOUBT THAT MANY OF THE DEPARTED COMEX LONGS RECEIVED THEIR PRIVATE EFP CONTRACT FOR EITHER APRIL OR JUNE. HOWEVER, WE HAD ANOTHER GOOD SIZED NUMBER OF COMEX LONG TRANSFERRING TO LONDON THROUGH THE EFP ROUTE: 22,672 CONTRACTS AS THESE HAVE ALREADY BEEN NEGOTIATED AND CONFIRMED. THERE OBVIOUSLY DOES NOT SEEM TO BE MUCH PHYSICAL GOLD AT THE COMEX AND YET WE ALSO OBSERVED A HUGE DELIVERY MONTH FOR THE MONTH OF DECEMBER. I GUESS IT EXPLAINS THE HUGE ISSUANCE OF EFP’S…THERE IS HARDLY ANY GOLD PRESENT AT THE GOLD COMEX FOR DELIVERY PURPOSES. IF YOU TAKE INTO ACCOUNT THE 22,672 EFP CONTRACTS ISSUED, WE HAD A NET GAIN IN OPEN INTEREST OF 39,309 contracts ON THE TWO EXCHANGES:
22,672 CONTRACTS MOVE TO LONDON AND 16,637 CONTRACTS INCREASED AT THE COMEX. (in tonnes, the GAIN in total oi equates to 122.26 TONNES).
we had: 1 notice(s) filed upon for 100 oz of gold.
xxxxxxxxxxxxxxxxxxxxxxxxxxxxxxxxxxxxxxxxxxxxxxxxxxxxxxxxxxx
With respect to our two criminal funds, the GLD and the SLV:
GLD
WITH GOLD DOWN $2.45 TODAY, NO CHANGE IN GOLD INVENTORY AT THE GLD/
Inventory rests tonight: 823.66 tonnes.
SLV/
NO CHANGES IN SILVER INVENTORY AT THE SLV/ AGAIN WITH TODAY’S HUGE RISE IN SILVER PRICE: NO CHANGE IN INVENTORY
/INVENTORY RESTS AT 314.045 MILLION OZ/
end
First, here is an outline of what will be discussed tonight:
1. Today, we had the open interest in silver ROSE BY A HUGE 3070 contracts from 194,056 UP TO 197,126 (AND now A LITTLE FURTHER TO THE NEW COMEX RECORD SET ON FRIDAY/APRIL 21/2017 AT 234,787) DESPITE THE HUGE SIZED FALL IN PRICE OF SILVER (35 CENTS WITH RESPECT TO YESTERDAY’S TRADING). OUR BANKERS USED THEIR EMERGENCY PROCEDURE TO ISSUE ANOTHER GOOD 1731 PRIVATE EFP’S FOR MARCH AND 0 EFP CONTRACTS OR MAY (WE DO NOT GET A LOOK AT THESE CONTRACTS AS IT IS PRIVATE BUT THE CFTC DOES AUDIT THEM) AND 0 EFP’S FOR ALL OTHER MONTHS . EFP’S GIVE OUR COMEX LONGS A FIAT BONUS PLUS A DELIVERABLE PRODUCT OVER IN LONDON. WE HAD SOME COMEX SILVER COMEX LIQUIDATION. IF WE TAKE THE OI GAIN AT THE COMEX OF 3070 CONTRACTS TO THE 1731 OI TRANSFERRED TO LONDON THROUGH EFP’S, WE OBTAIN A GAIN OF 4801 OPEN INTEREST CONTRACTS . WE STILL HAVE A GOOD AMOUNT OF SILVER OUNCES THAT ARE STANDING FOR METAL IN JANUARY (SEE BELOW). THE NET GAIN TODAY IN OZ ON THE TWO EXCHANGES: 24.00 MILLION OZ!!!
RESULT: A HUGE SIZED INCREASE IN SILVER OI AT THE COMEX WITH THE HUGE SIZED GAIN OF 35 CENTS IN PRICE (WITH RESPECT TO YESTERDAY’S TRADING ). BUT WE ALSO HAD ANOTHER GOOD 1731 EFP’S ISSUED TRANSFERRING COMEX LONGS OVER TO LONDON. TOGETHER WITH THE GOOD SIZED AMOUNT OF SILVER OUNCES STANDING FOR FEBRUARY, DEMAND FOR PHYSICAL SILVER INTENSIFIES AS WE WITNESS MAJOR BANK SHORT COVERING ACCOMPANIED BY INCREASES IN GOFO AND SIFO RATES INDICATING SCARCITY.
(report Harvey)
.
2.a) The Shanghai and London gold fix report
(Harvey)
2 b) Gold/silver trading overnight Europe, Goldcore
(Mark O’Byrne/zerohedge
and in NY: Bloomberg
3. ASIAN AFFAIRS
)Late WEDNESDAY night/THURSDAY morning: Shanghai closed /Hang Sang CLOSED UP 599.83 or 1.97% / The Nikkei closed UP 310.81 POINTS OR 1.47%/Australia’s all ordinaires CLOSED UP 1.16%/Chinese yuan (ONSHORE) closed UP at 6.3415/Oil DOWN to 60.58 dollars per barrel for WTI and 63.84 for Brent. Stocks in Europe OPENED DEEPLY IN THE GREEN . ONSHORE YUAN CLOSED UP AGAINST THE DOLLAR AT 6.3415. OFFSHORE YUAN CLOSED UP AGAINST THE ONSHORE YUAN AT 6.2980//ONSHORE YUAN A LITTLE STRONGER AGAINST THE DOLLAR/OFF SHORE A LOT STRONGER TO THE DOLLAR/. THE DOLLAR (INDEX) IS A LOT WEAKER AGAINST ALL MAJOR CURRENCIES . CHINA IS HAPPY TODAY AS THEY BEGIN THEIR NEW YEAR ONE WEEK HOLIDAY TOMORROW
3a)THAILAND/SOUTH KOREA/NORTH KOREA
i)North Korea
b) REPORT ON JAPAN
Last night the Yen rose as Japanese machine orders crashed 11.9% month over month. Before central bank intervention the USA/Yen came close to 106.50
( zerohedge)
3 c CHINA
4. EUROPEAN AFFAIRS
5. RUSSIAN AND MIDDLE EASTERN AFFAIRS
6 .GLOBAL ISSUES
Seems that Chinese buyers have stopped buying Canadian properties: Cdn existing home sales crash in January.
( zero hedge)
7. OIL ISSUES
8. EMERGING MARKET
9. PHYSICAL MARKETS
Agnico Eagle beats the street by 2 cents. It also increases production guidance for both 2018 and 2019 and most importantly adds dramatically to its reserves to 20.6 million oz/
In times past, the most important part of the earnings report for major mining companies is not the income side of things but the reserves and the future production and costs. The street (the bankers) focused on current income instead of what is coming in the future.
( Agnico Eagle)
10. USA stories which will influence the price of gold/silver
i)Producer prices is generally considered a forerunner of inflation. Today’s reading shows PPI rose far more than expected in January, rising a good 2.7% year over year.
( zerohedge)
ii)Two regional Fed manufacturing reports send conflicting signals: The New York survey slid showing a slowdown but the Philly area survey rose.
However the key prices paid component which always leads to inflation rose in both surveys
( zerohedge)
ii b)Stagflation strikes with a vengeance as Industrial production sinks badly. So with the latest data provided, we inflation surging but the economy faltering.
(courtesy zerohedge)
iii)Trump agrees with some Democrats supporting a 25 cent Federal gas tax to help pay for infrastructure
( zerohedge)
iv)We have been telling you quite often that Trump wants his wall and block family migration. He now threatens the bipartisan immigration deal as there is no wall in the agreement
(courtesy zerohedge)
v)Part ii/ The folly of Central Bankers Keynesian philosophy
(courtesy David Stockman/ContraCorner Part ii)
vi)
A good article on the suspension of the Debt ceiling and where the USA debt is heading with respect to March 1.2019 where it is intended to be reinstated. The pundits figure that by that date the debt ceiling will be 22 trillion USA dollars
(courtesy Dave Kranzler/IRD)
vii)SWAMP STORIES
a)My goodness!! Adam Schiff now admits that the Democratic Memo contains “sources and methods”. It is interesting that he scolded the Republicans not to release their memo because it contained “sources and methods”
( zerohedge)
b)This does not look good for Kushner: both the IRS and the Dept of Justice subpoena investors in the Kushner companies.
( zerohedge)
c)I think most of expected this: Bruce Ohr hid his wife’s Fusion GPS payments form ethic officials as Bruce Ohr refused to obtain a conflict of interest waiver
( Luke Rosiak/DailyCaller)
Let us head over to the comex:
The total gold comex open interest ROSE BY A GIGANTIC 16,637 CONTRACTS UP to an OI level 528,382 WITH THE HUGE SIZED RISE IN THE PRICE OF GOLD ($27.40 GAIN WITH RESPECT TO YESTERDAY’S TRADING). WE HAD ZERO COMEX GOLD LIQUIDATION. HOWEVER THE CME REPORTS THAT THE BANKERS ISSUED ANOTHER STRONG COMEX TRANSFER THROUGH THE EFP ROUTE AS THESE LONGS RECEIVED A DELIVERABLE LONDON FORWARD TOGETHER WITH A FIAT BONUS. WE HAD AN ATMOSPHERIC SIZED 21922 EFP’S ISSUED FOR APRIL AND 750 EFP’s FOR JUNE AND ZERO FOR ALL OTHER MONTHS: TOTAL 22,672 CONTRACTS. THE OBLIGATION STILL RESTS WITH THE BANKERS ON THESE TRANSFERS. ALSO REMEMBER THAT THERE IS NO DOUBT A HUGE DELAY IN THE ISSUANCE OF EFP’S AND IT PROBABLY TAKES AT LEAST 48 HRS AFTER LONGS GIVE UP THEIR COMEX CONTRACTS FOR THEM TO RECEIVE THEIR EFP’S AS THEY ARE NEGOTIATING THIS CONTRACT WITH THE BANKS FOR A FIAT BONUS PLUS THEIR TRANSFER TO A LONDON FORWARD… THE COMEX IS NOW AN ABSOLUTE FRAUD!!
ON A NET BASIS IN OPEN INTEREST WE GAINED TODAY: 39,309 OI CONTRACTS IN THAT 22,672 LONGS WERE TRANSFERRED AS FORWARDS TO LONDON AND WE GAINED 16,637 COMEX CONTRACTS.
NET GAIN ON THE TWO EXCHANGES: 39,309 contracts OR 3,930,900 OZ OR 122.26 TONNES.
Result: A GIGANTIC SIZED INCREASE IN COMEX OPEN INTEREST WITH THE HUGE SIZED GAIN IN YESTERDAY’S GOLD TRADING ($27.40.) WE HAD ZERO COMEX GOLD LIQUIDATION. TOTAL OPEN INTEREST GAIN ON THE TWO EXCHANGES: 39,309 OI CONTRACTS..
We have now entered the active contract month of FEBRUARY where we lost 7 contracts to 1140 contracts. We had 0 notices filed upon yesterday, so we LOST 7 contracts or an additional 700 oz will NOT stand in this active contract month of February AND THEY JOINED OTHER EFP’S IN TRANSFERRING FOR A LONDON FORWARD.
March saw a GAIN of 183 contracts UP to 2299. April saw a GAIN of 16,639 contracts UP to 368,487. MARCH BECOMES THE FRONT MONTH FOR GOLD
We had 1 notice(s) filed upon today for 100 oz
PRELIMINARY COMEX VOLUME FOR TODAY: 459,239 contracts
CONFIRMED COMEX VOL. FOR YESTERDAY: 214,289 CONTRACTS
comex gold volumes are RISING AGAIN
Here is a summary of the latest gold trading volumes at the Comex per year
certainly the introduction of EFP’s has certainly had an effect:
Trading Volumes on the COMEX
Meanwhile, gold-trading volumes on the COMEX have never been higher:
end
xxxxxxxxxxxxxxxxxxxxxxxxxxxxxxxxxxxxxxxxxxxxxxxxxxxxxxxxxxxxxxxxxxxx
And now for the wild silver comex results.
Total silver OI ROSE BY A HUGE SIZED 3070 CONTRACTS FROM 194,056 UP TO 197,126 WITH YESTERDAY’S HUGE SIZED 35 CENT FALL IN TRADING). HOWEVER,WE WERE ALSO INFORMED THAT WE HAD ANOTHER HUGE SIZED 1731 EMERGENCY EFP’S FOR MARCH ISSUED BY OUR BANKERS (WITH 143 EFP CONTRACTS FOR MAY AND ZERO FOR ALL OTHER MONTHS) TO COMEX LONGS WHO RECEIVED A FIAT BONUS PLUS A DELIVERABLE PRODUCT OVER IN LONDON: THE TOTAL EFP’S ISSUED: 1731. THE SILVER BOYS HAVE STARTED TO MIGRATE TO LONDON FROM THE START OF DELIVERY MONTH AND CONTINUING RIGHT THROUGH UNTIL FIRST DAY NOTICE JUST LIKE WE ARE WITNESSING TODAY. USUALLY WE NOTED THAT CONTRACTION IN OI OCCURRED ONLY DURING THE LAST WEEK OF AN UPCOMING ACTIVE DELIVERY MONTH AS WE HAVE JUST SEEN IN GOLD TODAY. THIS PROCESS HAS JUST BEGUN IN EARNEST IN SILVER STARTING IN SEPTEMBER 2017. HOWEVER, IN GOLD, WE HAVE BEEN WITNESSING THIS FOR THE PAST 2 YEARS. NICK LAIRD WAS KIND ENOUGH TO SUPPLY US THE TOTAL FOR 2017 GOLD EFP’S AND IT WAS 6600 TONNES FOR THE ENTIRE YEAR. WE OBVIOUSLY HAD NO LONG COMEX SILVER LIQUIDATION BUT A HUGE SIZED GAIN IN TOTAL SILVER OI. WE ARE ALSO WITNESSING A FAIR AMOUNT OF SILVER OUNCES STANDING FOR COMEX METAL IN THIS NON ACTIVE JANUARY AS WELL AS THAT CONTINUAL MIGRATION OF EFPS OVER TO LONDON. ON A PERCENTAGE BASIS THERE ARE MORE EFP’S ISSUED FOR GOLD THAN SILVER. ON A NET BASIS WE GAINED 4801 SILVER OPEN INTEREST CONTRACTS:
3070 CONTRACT GAIN AT THE COMEX COMBINING WITH THE ADDITION OF 1731 OI CONTRACTS NAVIGATING OVER TO LONDON.
NET GAIN TWO EXCHANGES: 4801 CONTRACTS
We are now in the poor non active delivery month of FEBRUARY and here the front month GAINED 198 contracts UP TO 254 contracts. We had 3 notices filed upon yesterday so we GAINED 195 contracts or 975,000 ADDITIONAL oz will stand for delivery at the comex
The March contract lost 969 contracts DOWN to 87,303
April GAINED 59 contracts UP to 155 .
.
We had 3 notice(s) filed for 15,000 OZ for the FEBRUARY 2018 contract for silver
INITIAL standings for FEBRUARY
Feb 15/2018.
Gold Ounces
Withdrawals from Dealers Inventory in oz nil oz
Withdrawals from Customer Inventory in oz
190.24 oz
Delaware
Deposits to the Dealer Inventory in oz nil oz
Deposits to the Customer Inventory, in oz
No of oz served (contracts) today
1 notice(s)
100 OZ
No of oz to be served (notices)
1139 contracts
(113900 oz)
Total monthly oz gold served (contracts) so far this month
1784 notices
178400 oz
5.5489 tonnes
Total accumulative withdrawals of gold from the Dealers inventory this month NIL oz
Total accumulative withdrawal of gold from the Customer inventory this month xxx oz
we had 0 kilobar transaction/
We had 0 inventory movement at the dealer accounts
total inventory deposit into the dealer accounts: nil oz
we had 1 withdrawal out of the customer account:
i) out of Delaware: 190.24 oz
total withdrawal: 190/24 oz
we had 0 customer deposit
total customer deposits: nil oz
we had 0 adjustments
total registered or dealer gold: 402,632,052 oz or 12.52 tonnes
total registered and eligible (customer) gold; 9,108,086.938 oz 283.30 tones
For FEBRUARY:
Today, 0 notice(s) were issued from JPMorgan dealer account and 1 notices were issued from their client or customer account. The total of all issuance by all participants equates to 1 contract(s) of which 1 notices were stopped (received) by j.P. Morgan dealer and 0 notice(s) was (were) stopped/ Received) by j.P.Morgan customer account.
xxxxxxxxxxxxxxxxxxxxxxxxxxxxxxxxxxxxxxxxxxxxxxxxxxxxxxxxxxxxxxxxxxxxxxxxxx
To calculate the INITIAL total number of gold ounces standing for the FEBRUARY. contract month, we take the total number of notices filed so far for the month (1784) x 100 oz or 178,300 oz, to which we add the difference between the open interest for the front month of FEB. (1140 contracts) minus the number of notices served upon today (1 x 100 oz per contract) equals 292,300 oz, the number of ounces standing in this active month of FEBRUARY
Thus the INITIAL standings for gold for the FEBRUARY contract month:
No of notices served (1784 x 100 oz or ounces + {(1140)OI for the front month minus the number of notices served upon today (1 x 100 oz )which equals 292,300 oz standing in this active delivery month of February (9.091 tonnes). THERE IS 12.52 TONNES OF REGISTERED GOLD AVAILABLE FOR DELIVERY SO FAR.
WE LOST 7 CONTRACTS OR AN ADDITIONAL 700 OZ WILL NOT STAND IN THIS ACTIVE DELIVERY MONTH OF FEBRUARY.
THE COMEX IS NOW UNDER STRESS AS THE REGISTERED GOLD FALLS BELOW 13 TONNES AS WELL AS HUGE NUMBER OF TONNES LEAVING THE CUSTOMER ACCOUNT
xxxxxxxxxxxxxxxxxxxxxxxxxxxxxxxxxxxxxxxxxxxxxxxxxxxxxxxxxxxxxxxxxxxxxxx
XXXXXXXXXXXXXXXXXXXXXXXXXXXXXXXXXXXXXXXXXXXXXXXX
IN THE LAST 17 MONTHS 71 NET TONNES HAS LEFT THE COMEX.
end
And now for silver
AND NOW THE DECEMBER DELIVERY MONTH
FEBRUARY FINAL standings
feb 15 2018
Silver Ounces
Withdrawals from Dealers Inventory nil oz
Withdrawals from Customer Inventory
1,806,683.364 oz
CNT
Delaware
Scotia
Deposits to the Dealer Inventory
nil
oz
Deposits to the Customer Inventory
1 573,745.260 oz
JPM
Scotia
No of oz served today (contracts)
1
CONTRACT(S
(5,000 OZ)
No of oz to be served (notices)
253 contracts
(1,265,000 oz)
Total monthly oz silver served (contracts) 308 contracts
(1,540,000 oz)
Total accumulative withdrawal of silver from the Dealers inventory this month NIL oz
Total accumulative withdrawal of silver from the Customer inventory this month
we had zero inventory movement at the dealer side of things
total inventory movement dealer: nil oz
we had 2 inventory deposits into the customer account
i) into J.P.MORGAN:994,507.590 oz ***
ii) Into Scotia: 579,237.620 oz
total inventory deposits: 1,573,745.260 oz
*** JPMorgan is continually adding to its inventory almost every single day.
JPMorgan now has 133 million oz of total silver inventory or 53% of all official comex silver.
we had 3 withdrawals from the customer account;
i) Out of Scotia: 544,315.070
ii) Out of CNT: 748,808.164 oz
iii) Out of Delaware:: 512,619.730 oz
total withdrawals; 65,079.95 oz
we had 0 adjustment
total dealer silver: 43.827 million
total dealer + customer silver: 252.477 million oz
The total number of notices filed today for the FEBRUARY. contract month is represented by 1 contract(s) FOR 5,000 oz. To calculate the number of silver ounces that will stand for delivery in FEBRUARY., we take the total number of notices filed for the month so far at 308 x 5,000 oz = 1,540,000 oz to which we add the difference between the open interest for the front month of FEB. (56) and the number of notices served upon today (1 x 5000 oz) equals the number of ounces standing.
.
Thus the INITIAL standings for silver for the FEB contract month: 308(notices served so far)x 5000 oz + OI for front month of FEBRUARY(254) -number of notices served upon today (1)x 5000 oz equals 2,805,000 oz of silver standing for the FEBRUARY contract month.
WE GAINED 195 CONTRACTS OR AN ADDITIONAL 975,000 OZ WILL STAND AT THE COMEX. SOMEBODY WAS BADLY IN DEEP OF PHYSICAL SILVER AT THE COMEX
xxxxxxxxxxxxxxxxxxxxxxxxxxxxxxxxxxxxxxxxxxxxxxxxxxxxxxxxxxx
ESTIMATED VOLUME FOR TODAY: 91,562 CONTRACTS
CONFIRMED VOLUME FOR YESTERDAY: 119,981 CONTRACTS
YESTERDAY’S CONFIRMED VOLUME OF 119,981 CONTRACTS EQUATES TO 600 MILLION OZ OR 85.6% OF ANNUAL GLOBAL PRODUCTION OF SILVER
COMMODITY LAW SUGGESTS THAT OPEN INTEREST SHOULD NOT BE MORE THAN 3% OF ANNUAL GLOBAL PRODUCTION. THE CROOKS ARE SUPPLYING MASSIVE PAPER TRYING TO KEEP SILVER IN CHECK.
The record level of silver open interest is 234,787 contracts set on April 21./2017 with the price at that day at $18.42
The previous record was 224,540 contracts with the price at that time of $20.44
end
NPV for Sprott
1. Sprott silver fund (PSLV): NAV RISES TO -1.83% (FEB 14/2018)
2. Sprott gold fund (PHYS): premium to NAV RISES TO -0.34% to NAV (FEB 14/2018 )
Note: Sprott silver trust back into NEGATIVE territory at -1.83%-/Sprott physical gold trust is back into NEGATIVE/ territory at -0.34%/Central fund of Canada’s is still in jail but being rescued by Sprott.
Sprott WINS hostile 3.1 billion bid to take over Central Fund of Canada
(courtesy Sprott/GATA)
3.SPROTT CEF.A FUND (FORMERLY CENTRAL FUND OF CANADA): NAV FALLS TO -3.75%: NAV 13.96/TRADING 13.44//DISCOUNT 4.41%
END
And now the Gold inventory at the GLD/
Feb 15/NO CHANGE IN GOLD INVENTORY AT THE GLD/INVENTORY RESTS AT 823.66 TONNES
Feb 14/AN ADDITIONAL OF 2.95 TONNES OF GOLD INTO GLD WITH THE HUGE GAIN OF 27.40 IN PRICE/INVENTORY RESTS AT 823.66 TONNES
Feb 13/WITH GOLD UP $3.40 WE HAD NO CHANGE IN GOLD INVENTORY AT THE GLD/INVENTORY REMAINS AT 820.71 TONNES
Feb 12/STRANGE!!WITH GOLD RISING BY 12.00 DOLLARS, THE CROOKS DECIDED AGAIN TO WITHDRAW 5.6 TONNES OF GOLD FOR EMERGENCY USE ELSEWHERE/INVENTORY RESTS AT 820.71 TONNES
Feb 9/AGAIN WITH HUGE TURMOIL ON THE MARKETS, THE CROOKS WITHDREW 2 TONNES OF GOLD FROM THE GLD INVENTORY/INVENTORY RESTS AT 826.31 TONNES
Feb 8/DESPITE THE GOOD GAIN IN PRICE FOR GOLD TODAY/THE CROOKS REMOVED .96 TONNES FROM THE GLD INVENTORY/INVENTORY RESTS AT 828.31 TONNES
FEB 7/AN UNBELIEVABLE 12.08 TONNES WAS REMOVED BY THE CROOKED BANKERS AND THIS GOLD WAS USED IN THE ASSAULT THESE PAST FEW DAYS/INVENTORY RESTS AT 829.27 TONNES
Feb 6/AGAIN VERY STRANGE: WITH TODAY’S TURMOIL, THE CROOKS DID NOT ADD ANY GOLD INVENTORY INTO THE GLD/INVENTORY REMAINS AT 841.35 TONNES
Feb 5 Strange,with all of today’s turmoil, the crooks at the GLD decided to add zero ounces into GLD inventory/inventory rests at 841.35 tonnes
Feb 2/no change in gold inventory at the GLD/Inventory rests at 841.35 tonnes
Feb 1/with gold up by $8.00/the crooks decided not to add any new physical gold metal into the GLD./inventory rests at 841.35 tonnes
Jan 31/with gold up $3.15 today, GLD shed another 5.32 tonnes of gold from its inventory/inventory rests at 841.35 tonnes
jan 30/with gold down by $4.85/GLD shed another 1.47 tonnes of gold from its inventory/inventory rests at 846.67 tonnes
JAN 29/with gold down $11.25, the GLD shed 1.18 tonnes of gold/inventory rests at 848.14 tonnes
jan 26/2018/no changes in gold inventory at the GLD/inventory rests at 849.32 tonnes
jan 25/no changes in gold inventory at the GLD/inventory rests at 849.32 tonnes
Jan 24/A HUGE DEPOSIT OF 2.65 TONNES OF GOLD INTO GLD/INVENTORY RESTS AT 849.32 TONNES
Jan 23/NO CHANGE IN GOLD INVENTORY DESPITE GOLD’S RISE/INVENTORY RESTS AT 846.67 TONNES
Jan 22/a huge deposit of 5.71 tonnes of gold despite a drop in price/inventory rests at 846.67 tonnes. In 3 trading days, the GLD has added 17.71 tonnes/the bankers are now in trouble!!
Jan 19/no change in gold inventory at the GLD/Inventory rests at 840.76 tonnes
Jan 18/SHOCKINGLY A HUGE DEPOSIT OF 11.80 TONNES WITH GOLD DOWN ALMOST $12.00/INVENTORY RESTS AT 840.76
Jan 17/no changes in gold inventory at the GLD/inventory rests at 828.96 tonnes
Jan 16/NO CHANGES IN GOLD INVENTORY AT THE GLD/INVENTORY RESTS AT 828.96 TONNES
Jan 12/no changes in inventory at the GLD despite the rise in gold price/inventory rests at 828.96 tonnes
Jan 11/ANOTHER IDENTICAL WITHDRAWAL OF 2.95 TONNES FROM THE GLD INVENTORY/INVENTORY RESTS AT 828.96 TONNES
xxxxxxxxxxxxxxxxxxxxxxxxxxxxxxxxxx
Feb 15/2018/ Inventory rests tonight at 823.66 tonnes
*IN LAST 326 TRADING DAYS: 117.49 NET TONNES HAVE BEEN REMOVED FROM THE GLD
*LAST 256 TRADING DAYS: A NET 39.82 TONNES HAVE NOW BEEN ADDED INTO GLD INVENTORY.
end
Now the SLV Inventory
Feb 15/NO CHANGE IN SILVER INVENTORY AT THE SLV/INVENTORY RESTS AT 314.045 MILLION OZ/
Feb 14./NO CHANGE IN SILVER INVENTORY DESPITE THE HUGE RISE IN PRICE/INVENTORY RESTS AT 314.045 MILLION OZ
Feb 13./NO CHANGE IN SILVER INVENTORY TODAY/INVENTORY RESTS AT 314.045 MILLION OZ/
Feb 12/AGAIN, WITH TODAY’S HUGE RISE IN SILVER PRICE, IN TOTAL CONTRAST TO GOLD: NO CHANGE IN SILVER INVENTORY/INVENTORY RESTS AT 314.045 MILLION OZ/
Feb 9/AGAIN WITH TURMOIL ON THE MARKETS, STRANGELY IN TOTAL CONTRAST TO GOLD: NO CHANGE IN SILVER INVENTORY/INVENTORY RESTS AT 314.045 MILLION OZ/
Feb 8/DESPITE THE TURMOIL TODAY AND A PRICE RISE: NO CHANGE IN SILVER INVENTORY AT THE SLV/INVENTORY RESTS AT 314.045 MILLION OZ/
FEB 7/no change in silver inventory at the SLV/Inventory rests at 314.045 million oz/
Feb 6/WITH ALL OF TODAY’S TURMOIL/NO CHANGE IN SILVER INVENTORY AT THE SLV/INVENTORY RESTS AT 314.045 MILLION OZ/
Feb 5/ we had HUGE change in silver inventory at the SLV/ A DEPOSIT OF 1.131 MILLION OZ INTO THE SLV/Inventory rests at 314.045 million oz/
Feb 2/we lost 982,000 oz from the SLV inventory /inventory rests at 312.914 million oz/
Feb 1/no change in silver inventory at the SLV/Inventory rests at 313.896 million oz/
Jan 31/ no change in inventory at the slv in total contrast to gold/inventory rests at 313.896 million oz/
Jan 30/no change in inventory/SLV inventory rests at 313.896 million oz/
Jan 29/no change in inventory/SLV inventory rests at 313.896 million oz/
Jan 26.2018/inventory rests at 313.896 million oz
Jan 25/with silver up today and yesterday, the SLV could only muster a gain of 848,000 oz
Inventory rests at 313.896 oz
jan 24/NO CHANGE IN SILVER INVENTORY DESPITE THE GOOD ADVANCE IN PRICE/INVENTORY RESTS AT 313.048 MILLION OZ/
Jan 23/ANOTHER HUGE WITHDRAWAL OF 1.131 MILLION OZ OF SILVER DESPITE THE TINY LOSS/THE CROOKS ARE USING THE INVENTORY TO RAID ON SILVER.
JAN 22.2018/with silver down by 5 cents/ the crooks at the SLV liquidate 1.321 million oz of silver/inventory rests at 314.179 million oz/
Jan 19/ no changes in silver inventory at the SLV/inventory rests at 315.500 million oz/
jan 18/A WITHDRAWAL OF 848,000 OZ OF SILVER FROM THE SLV/INVENTORY RESTS AT 315.500 MILLION OZ/
Jan 17/no changes in silver inventory at the SLV/inventory rests at 316.348 million oz/
Jan 16/NO CHANGES IN SILVER INVENTORY AT THE SLV/INVENTORY RESTS AT 316.348 MILLION OZ
Jan 12/no changes in silver inventory at the SLV/inventory rests at 316.348 million oz/
Feb 14/2017:
Inventory 314.045 million oz
end
6 Month MM GOFO
Indicative gold forward offer rate for a 6 month duration
+ 1.70%
12 Month MM GOFO
+ 2.10%
end
Major gold/silver trading /commentaries for THURSDAY
GOLDCORE/BLOG/MARK O’BYRNE.
GOLD/SILVER
GoldCore
Is The Gold Price Heading Higher? IG TV Interview GoldCore
15, February
Is The Gold Price Heading Higher? IG TV Interview GoldCore
Research Director at GoldCore, Mark O’Byrne talks to IG TV’s Victoria Scholar about the outlook for the gold price.
In this interview, Mark O’Byrne, research director at Goldcore, says the fact that the gold price did not spike during last week’s equity sell-off was to be expected.
He said even at the height of the global financial crisis, amid the collapse in the Wall Street behemoth Lehman Brothers, gold prices fell. O’Byrne says gold’s hedge abilities and safe haven attributes are seen more in the medium to long term. Also, he points out that there was a big move up in December in the gold price, so a period of correction was expected.
O’Byrne says periods of rising interest rates have historically coincided with bull markets for gold. He cites the 1970s, and the period between 2003 and 2007, when gold prices did very well.
In terms of key levels, O’Byrne says there is resistance around $1360 before we head to $1400. He says he is cautious in the short term but feeling constructive for 2018 overall, and says $1500 is quite likely by autumn, although it could end 2018 above $1400.
Watch Interview On IG TV Here
News and Commentary
Gold holds steady near 2-1/2-week high as dollar dips (Reuters.com)
Paulson Maintained SPDR Gold Stake as Dollar Boosted Metal (Bloomberg.com)
Gold rallies to highest settlement in nearly 3 weeks on hotter-than-expected CPI (MarketWatch.com)
Gold quickly reverses US CPI-led fall, jumps back closer to session tops (FXStreet.com)
Gold rebounds from U.S inflation data-driven losses as dollar wilts (Reuters.com)

Source: Bloomberg
Gold Shines as Traders Count Down to ‘Critical’ CPI, Dalio Buys (Bloomberg.com)
Dalio’s Bridgewater Boosts Holdings in Gold (Bloomberg.com)
These Are the World’s Most Miserable Economies (Bloomberg.com)
Williams: “It’s The Long-Term Insolvency Of The US Government That Markets Don’t Like” (ZeroHedge.com)
Bullish Fundamentals To Push Gold Above $3,000 by 2020 (Gold-Eagle.com)
Gold Prices (LBMA AM)
14 Feb: USD 1,330.75, GBP 959.74 & EUR 1,077.77 per ounce
13 Feb: USD 1,329.40, GBP 955.04 & EUR 1,077.61 per ounce
12 Feb: USD 1,321.70, GBP 955.19 & EUR 1,077.45 per ounce
09 Feb: USD 1,316.05, GBP 945.58 & EUR 1,072.84 per ounce
08 Feb: USD 1,311.05, GBP 944.87 & EUR 1,071.13 per ounce
07 Feb: USD 1,328.50, GBP 956.12 & EUR 1,075.95 per ounce
06 Feb: USD 1,344.65, GBP 962.50 & EUR 1,083.52 per ounce
Silver Prices (LBMA)
14 Feb: USD 16.58, GBP 11.97 & EUR 13.43 per ounce
13 Feb: USD 16.61, GBP 11.94 & EUR 13.46 per ounce
12 Feb: USD 16.43, GBP 11.86 & EUR 13.39 per ounce
09 Feb: USD 16.36, GBP 11.83 & EUR 13.37 per ounce
08 Feb: USD 16.35, GBP 11.70 & EUR 13.36 per ounce
07 Feb: USD 16.69, GBP 12.02 & EUR 13.52 per ounce
06 Feb: USD 16.81, GBP 12.07 & EUR 13.59 per ounce
Recent Market Updates
– Global Debt Crisis II Cometh
– Sovereign Wealth Funds Investing In Gold For “Long Term Returns” – PwC
– Bitcoin and Crypto Prices Being Manipulated Like Precious Metals?
– “This Is Where They Completely Lost Their Minds” – Hussman
– Brexit Risks Increase – London Property Market and Pound Vulnerable
– Peak Gold: Global Gold Supply Flat In 2017 As China Output Falls By 9%
– Crypto Currency Backlash Sees Flight From Cryptos and Bitcoin
– Gold Rises As Global Stocks Plunge and Bitcoin Crashes 70%
– Shrinkflation Intensifies – Stealth Inflation As Thousands of Food Products Shrink In Size, Not Price
– U.S. Debt Is “Extraordinarily High” and Are Stock And Bond Bubbles – Greenspan
– Gold Bullion Price Suppression To End? Bullion Bank Traders Arrested For Manipulating Market
– ATMs Hit By Malware “Jackpotting” Attacks That Dispense All Cash In Minutes
– London Property Market Tumbles As Glut of Luxury Apartments Grows To 3,000
Mark O’Byrne
Executive Director
END
I wrote the following early this morning at the onset of AEM trading on NY with AEM down around $1.12
Agnico Eagle beats the street by 2 cents. It also increases production guidance for both 2018 and 2019 and most importantly adds dramatically to its reserves to 20.6 million oz/
In times past, the most important part of the earnings report for major mining companies is not the income side of things but the reserves and the future production and costs. The street (the bankers) focused on current income instead of what is coming in the future.
The smart guys came in and pushed the stock to a positive gain
xxxxxxxxxxxxxxxxxxxxxxxxxxxxxxxxxxxxxxxxxxxxxxxxxxxxxxxxxx
Your early THURSDAY morning currency, Asian stock market results, important USA/Asian currency crosses, gold/silver pricing overnight along with the price of oil Major stories overnight/9 AM EST
i) Chinese yuan vs USA dollar/CLOSED UP AT 6.3444 /shanghai bourse CLOSED / HANG SANG CLOSED UP 599.83 POINTS OR 1.97%
2. Nikkei closed UP 310,81 POINTS OR 1.47% /USA: YEN FALLS TO 106.76/DEADLY AS YEN CARRY TRADERS DISINTEGRATE
3. Europe stocks OPENED DEEPLY IN THE GREEN /USA dollar index FALLS TO 88.81/Euro RISES TO 1.2469
3b Japan 10 year bond yield: RISES TO . +.067/ !!!!(Japan buying 100% of bond issuance)/Japanese yen vs usa cross now at 106.76/ THIS IS TROUBLESOME AS BANK OF JAPAN IS RUNNING OUT OF BONDS TO BUY./JAPAN 10 YR YIELD FINALLY IN THE POSITIVE/BANK OF JAPAN LOSING CONTROL OF THEIR YIELD CURVE AS THEY PURCHASE ALL BONDS TO GET TO ZERO RATE!!
3c Nikkei now JUST BELOW 17,000
3d USA/Yen rate now well below the important 120 barrier this morning
3e WTI:: 60.58 and Brent: 63.58
3f Gold DOWN/Yen DOWN
3g Japan is to buy the equivalent of 108 billion uSA dollars worth of bond per month or $1.3 trillion. Japan’s GDP equals 5 trillion usa./“HELICOPTER MONEY” OFF THE TABLE FOR NOW /REVERSE OPERATION TWIST ON THE BONDS: PURCHASE OF LONG BONDS AND SELLING THE SHORT END
Japan to buy 100% of all new Japanese debt and by 2018 they will have 25% of all Japanese debt. Fifty percent of Japanese budget financed with debt.
3h Oil UP for WTI and UP FOR Brent this morning
3i European bond buying continues to push yields lower on all fronts in the EMU. German 10yr bund RISES TO +.789%/Italian 10 yr bond yield UP to 2.078% /SPAIN 10 YR BOND YIELD UP TO 1.520%
3j Greek 10 year bond yield FALLS TO : 4.37?????????????????
3k Gold at $1349.80 silver at:16.83 7 am est) SILVER NEXT RESISTANCE LEVEL AT $18.50
3l USA vs Russian rouble; (Russian rouble UP 14/100 in roubles/dollar) 56.87
3m oil into the 60 dollar handle for WTI and 63 handle for Brent/
3n Higher foreign deposits out of China sees huge risk of outflows and a currency depreciation. This can spell financial disaster for the rest of the world/
JAPAN ON JAN 29.2016 INITIATES NIRP. THIS MORNING THEY SIGNAL THEY MAY END NIRP. TODAY THE USA/YEN TRADES TO 106.76 DESTROYING JAPANESE CITIZENS WITH HIGHER FOOD INFLATION
30 SNB (Swiss National Bank) still intervening again in the markets driving down the SF. It is not working: USA/SF this morning 0.9250 as the Swiss Franc is still rising against most currencies. Euro vs SF is 1.1534 well above the floor set by the Swiss Finance Minister. Thomas Jordan, chief of the Swiss National Bank continues to purchase euros trying to lower value of the Swiss Franc.
3p BRITAIN VOTES AFFIRMATIVE BREXIT/LOWER PARLIAMENT APPROVES BREXIT COMMENCEMENT/ARTICLE 50 COMMENCES MARCH 29/2017
3r the 10 Year German bund now POSITIVE territory with the 10 year RISING to +0.789%
The bank withdrawals were causing massive hardship to the Greek bank. the Greek referendum voted overwhelming “NO”. Next step for Greece will be the recapitalization of the banks and that will be difficult.
4. USA 10 year treasury bond at 2.9333% early this morning (THIS IS DEADLY TO ALL MARKETS). Thirty year rate at 3.186% /BOTH VERY DEADLY
5. Details Ransquawk, Bloomberg, Deutsche bank/Jim Reid.
(courtesy Jim Reid/Bloomberg/Deutsche bank/zero hedge)
Global Stocks, S&P Futures Soar, Ignoring Yields Creeping Ever Closer To 3.00%
Profile picture for user Tyler Durden
by Tyler Durden
Thu, 02/15/2018 – 07:02
10
SHARES
Global stocks, bond yields and commodities all jumped higher on Thursday while the dollar plunge continued, as investors suddenly seemed to forget the inflation fears blamed for a brutal market sell-off in recent weeks.
Last week’s volocaust is a fading, distant memory, and this morning global stocks – albeit without China which is on weekly holiday for the Lunar New Year – continue their relentless surge with the Dow set to open back over 25,000, even as yields rise and the 10Y is fast approaching 3.00%, thanks to a plunging dollar which fell for a firth day, keeping financial condition well lubricated. As a result, global stocks and futures are a sea of green this morning despite growing inflationary noise in the background.

Commenting on the overnight price action, one major bank said it can be briefly summarized as: bearish USD, bearish fixed income, bullish equities, bullish oil. As the trader notes, “We’ve definitely been here before – in fact, it was the consensus trade for 2018 until the recent market rout questioned the move.” Therefore there’s certainly a sense of déjà vu as the paradoxical moves in markets continue at least until inflation fears hit the next tipping point and launch the next equity market selloff.
In the meantime, one can scratch their heads: the bank adds that “the bewildering nature of recent price action has become a somewhat familiar feature of markets lately.”
One needs just three charts to understand what is going on on most days: futures are up, as they are this morning…

… even if yields are sharply higher, which they also are as the 10Y rises above 2.93%…
… as long as the dollar is tumbling, and financial conditions are looser.

As Reuters notes, economists were struggling to explain the turnaround except for the argument that historically it’s not unusual for stocks and bond market borrowing costs to rise in tandem with a rapidly expanding economy.
Some just blamed the weather and time of year. They speculated that strong U.S. inflation data on Wednesday that many had predicted could reignite the rout was probably distorted. They also said the looming Chinese New Year may have caused Asian traders to square up.
Meanwhile, bond traders increased their expectations for the number of Federal Reserve interest-rate hikes to four by the end of next year after yesterday’s blistering CPI report. The inflation figures gave rise to debate among investors and traders on the breakdown in correlations to interest rates, as currency investors focused instead on the U.S.’s twin deficits.
“For me it’s a clear indication that inflation is not as big a threat as people made it out to be over the past couple of weeks,” said Lukas Daalder, chief investment officer at Robeco in Rotterdam. “The trend behind the market is still very strongly pointed upwards. 2017 was a very momentum-driven market, and if that’s still the case, which after yesterday it appears to be, then we will probably see new highs before too long.”
Volatility shrank back rapidly too. The VIX index fell all the way back to 18, less than half the 50-point peak touched last week.
* * *
Whatever the reason, the animal spirits were back. However, should the dollar and yields rise at the same time, run.
For now, China is off to enjoy the Lunar New Year and welcome the Year of the Dog, and there’s another celebration in EM FX as the ZAR continues to revel in the resignation of Zuma.
The Stoxx Europe 600 Index took its cue from a rally in the truncated Asian session, to advance for a second day – ignoring the growing, $22 billion Bridgewater short of European stocks – as traders assessed earnings from heavyweights including Nestle and Airbus while eyeing rising bond yields that may be approaching a critical level for the direction of equity markets.
As a result, the Stoxx 600 climbed 0.4%, heading for a weekly gain of ~2%. Airbus advanced 8.9% in the best performance among single stocks on the gauge after the planemaker struck an optimistic tone in its outlook for 2018, promising earnings growth of 20%. Nestle dropped 2.6% after it posted the weakest sales growth in more than 20 years. Elsewhere, South African exposed Old Mutual (+3.8%) and Anglo American (+3.0%) lead the FTSE 100 as South Africa now eyes life-after Zuma with Ramaphosa now appointed as Preisdent. Miners occupy a bulk of the other outperformers in the UK amid movements in the commodity complex with Antofagasta (+2.9%) also lifted after winning approval for a USD 1.1bln revamp of its Los Pelambres copper mine.
In Asia, Australia’s ASX 200 (+1.2%) was positive with its biggest movers dictated by earnings releases and as commodity names were underpinned by strength in the complex. Elsewhere, Nikkei 225 (+1.5%) advanced and managed to ignore the latest plunge in the USDJPY, which took out downside stops after Finance Minister Taro Aso said the currency’s strength isn’t abrupt enough to require intervention– as well as a slump in machine orders, while Hang Seng (+1.6%) closed the session as the outperformer in a holiday-shortened session, before it joined mainland China for Lunar New Year celebrations.
In FX, it was all about the ongoing dollar weakness, which persisted pushing the Bloomberg Dollar Index down a fifth day. The dollar tumbled though across the board, including to a 15-month low against the yen of 106.18 yen as worries about the U.S. government’s finances seemed to set again after a White House-led spending splurge and recent corporate tax cuts. That also marked a drop of 3.8 percent from its early February peak near 110.50 yen, while the euro and pound both climbed back above the $1.25 and $1.40 thresholds.
“The story I hear most frequently from people is it’s the re-emergence of the twin deficits,” said RBC Capital Markets head of currency strategy Adam Cole, in London, of the dollar’s persistent weakness. “There seem to be concerns on the U.S. fiscal position and what that implies for the current account.”
The EUR/USD climbed a fifth day, approaching Jan. 25 high of 1.2537, which was the highest since Dec. 2014, while GBP/USD sustains advance over 1.40 on reports of the EU’s softening Brexit stance, set for fourth daily rise. As noted above, the USD/JPY slipped; the yen earlier touched its strongest level since Nov. 2016 versus the dollar on comments from the finance minister dismissing the need for intervention. The South African rand was the biggest gainer versus the dollar among its major peers on news of Jacob Zuma’s resignation; the rand appreciated to its strongest level since Feb. 2015.
Looking at the ongoing Brexit drama, UK PM May is reportedly facing a crisis related to the Brexit border deal, after Northern Ireland power sharing discussions were said to have collapsed. Separately the Telegraph reported that the EU will demand the right to raid financial services firms in Britain after Brexit and hand its regulators sweeping new powers, as Brussels moves to shackle the City of London with red tape after the UK leaves the bloc. Finally, in some good news, the BBC reported that EU diplomats have removed a so-called “punishment clause” from a draft text of the arrangement for the Brexit transition period, the BBC understands. However, it was later reported that the EU denied this was the case…
In the commodities complex, WTI and Brent crude futures trade in close proximity to recent highs seen in the wake of yesterday’ssmaller than expected build in the DoEs and comments from Saudi with prices also supported by the broad softness in the USD. Inmetals, gold prices have also benefitted from the softer USD, although gains are likely capped by the broad-based risk sentiment inthe market. Elsewhere, copper prices have hit their highest level in 10 days amid this morning’s risk environment, while priceaction was relatively limited during Asia-Pac trade given the closure of the Shanghai Futures Exchange for the Lunar New Year holiday.
Market Snapshot
S&P 500 futures up 0.8% to 2,718.50
STOXX Europe 600 up 0.8% to 377.54
MSCI Asia Pacific up 1.4% to 176.14
MSCI Asia Pacific ex Japan up 1.3% to 578.63
Nikkei up 1.5% to 21,464.98
Topix up 1% to 1,719.27
Hang Seng Index up 2% to 31,115.43
Shanghai Composite up 0.5% to 3,199.16
Sensex up 0.4% to 34,273.84
Australia S&P/ASX 200 up 1.2% to 5,908.99
Kospi up 1.1% to 2,421.83
German 10Y yield rose 2.4 bps to 0.781%
Euro up 0.3% to $1.2492
Italian 10Y yield fell 2.0 bps to 1.795%
Spanish 10Y yield rose 0.6 bps to 1.52%
Brent futures up 0.2% to $64.49/bbl
Gold spot up 0.3% to $1,354.33
U.S. Dollar Index down 0.4% to 88.76
Top Overnight News from Bloomberg
Cyril Ramaphosa faces a tough road ahead as South Africa’s new president after Jacob Zuma’s resignation late Wednesday ended nine years of his scandal-marred administration. Ramaphosa remains acting president until his expected election in parliament later Thursday
U.S. tax authorities have requested documents from lenders and investors in real estate projects managed by Jared Kushner’s family, according to a person familiar with the matter.
Japanese Finance Minister Aso said the yen’s recent move isn’t abrupt enough to warrant intervention causing the yen to climb
A report from Politico that the European Union is looking to ease Brexit transition conditions, helped support the pound
Merkel vows to ensure Germany maintains balanced budget
Japan’s Aso says yen strength isn’t abrupt enough now to intervene
Kuroda says BOJ will continue to take best policy for price target
Australia Jan jobs 16.0k vs 15.0k est; unempl. rate 5.5% vs 5.5% est
Singapore Jan exports -0.3% vs 4.2% est; y/y 13.0% vs 8.9% est
Asian stocks traded higher as the region received a tailwind from US where all major indices finished with firm gains and the DJIA posted its best 4-day performance in almost a decade. ASX 200 (+1.2%) was positive with its biggest movers dictated by earnings releases and as commodity names were underpinned by strength in the complex. Elsewhere, Nikkei 225 (+1.5%) advanced and managed to overlook a firmer JPY and slump in machine orders, while Hang Seng (+1.6%) closed the session as the outperformer in a holiday-shortened session, before it joined its mainland counterparts for Lunar New Year celebrations. Finally, 10yr JGBs were relatively flat with early mild pressure seen amid the uptick in riskier assets, although this was later counterbalanced amid the BoJ’s presence in the market for 1yr-10yr JGBs totalling over JPY 1tln.
Top Asian News
Philippine Central Bank Cuts Reserve Ratio by 1 Point to 19%
Abe Said to Be Likely to Nominate BOJ Governor on Friday
IDG-Backed China Online Credit-Checking Firm Is Said to Plan IPO
Cathay Pacific Supplier Topcast Aviation Is Said to Pursue Sale
European bourses trade higher across the board (Eurostoxx 50 +0.6%) in a continuation of the sentiment seen yesterday on Wall Street and overnight in Asia-Pac trade. On a sector basis, consumer staples underperform following lacklustre earnings from Swiss-titan Nestle (-2.2%), with the index heavyweight subsequently leading the SMI to lag its peers in the region. Elsewhere, South African exposed Old Mutual (+3.8%) and Anglo American (+3.0%) lead the FTSE 100 as South Africa now eyes life-after Zuma with Ramaphosa now appointed as Preisdent. Miners occupy a bulk of the other outperformers in the UK amid movements in the commodity complex with Antofagasta (+2.9%) also lifted after winning approval for a USD 1.1bln revamp of its Los Pelambres copper mine. Elsewhere, Standard Life (-4.9%) sits at the bottom of the FSTE 100 after Scottish Widows and Lloyds sent notices to co. to terminate investment management relations. Finally, earnings dominate the state of play in the CAC with Airbus (+9.3%), Schneider Electric (+3.6%) and CapGemini (+2.5%) all lifted by encouraging earnings.
Top European news
Dalio Causes Stir With $18 Billion Surge in European Short Bets
Austrian Bitcoin Scam May Affect Over 10,000 Users, Presse Says
In the Age of Brexit, Events Manager RELX Opts for London Base
In FX, Japan’s Finance Minister Aso has given the green light for Jpy bulls to charge on, and 106.00 vs the Usd is now within striking distance given little in the way of technical support until 105.85 vs the latest 106.20 low. Moreover, all other G10 rivals are eyeing recent peaks vs the Greenback with Cable just eclipsing the 1.4067 level posted after the BoE’s hawkish policy guidance shift on February 8th, while Eur/Usd almost challenged Fib resistance at 1.2518 ahead of the 1.2537 year to date high before slipping back below 1.2500. Usd/Chf is toppy around the bottom of a 0.9300-0.9230 range, while Nzd/Usd has rebounded above the 0.7400 handle and Aud/Usd is over 0.7950 despite mixed jobs data overnight and ahead of RBA Governor Lowe orates later today. Usd/Cad relatively steady albeit sharply down from Wednesday’s post-US CPI data spike highs and sub-1.2500 amidst ongoing NAFTA uncertainty and awaiting a speech from BoC Deputy Governor Schembri. All this leaves the Dollar Index below 89.00 again and vulnerable against a deeper set-back towards 2018 lows under 88.50, especially as the Usd continues to suffer broader losses with the likes of Usd/Zar sliding towards 11.6400 in wake of the resignation of Zuma as SA President with immediate effect.
In the commodities complex, WTI and Brent crude futures trade in close proximity to recent highs seen in the wake of yesterday’s smaller than expected build in the DoEs and comments from Saudi with prices also supported by the broad softness in the USD. In metals, gold prices have also benefitted from the softer USD, although gains are likely capped by the broad-based risk sentiment in the market. Elsewhere, copper prices have hit their highest level in 10 days amid this morning’s risk environment, while price action was relatively limited during Asia-Pac trade given the closure of the Shanghai Futures Exchange for the Lunar New Year holiday.
Looking at the day ahead, the January PPI and IP, February empire manufacturing, February Philly Fed PMI, February NAHB housing market index and the latest weekly initial jobless claims readings are all due in the US. In Europe Q4 employment data in France and the December trade balance for the Euro area are due. The ECB’s Mersch and Praet are also slated to speak at an event in Paris.
US Event Calendar
8:30am: Empire Manufacturing, est. 18, prior 17.7
8:30am: Initial Jobless Claims, est. 228,000, prior 221,000; Continuing Claims, est. 1.93m, prior 1.92m
8:30am: PPI Final Demand MoM, est. 0.4%, prior -0.1%; Ex Food and Energy MoM, est. 0.2%, prior -0.1%
8:30am: PPI Final Demand YoY, est. 2.4%, prior 2.6%; Ex Food and Energy YoY, est. 2.0%, prior 2.3%
8:30am: Philadelphia Fed Business Outlook, est. 21.6, prior 22.2
9:15am: Industrial Production MoM, est. 0.2%, prior 0.9%; Manufacturing (SIC) Production, est. 0.25%, prior 0.1%
10am: NAHB Housing Market Index, est. 72, prior 72
4pm: Total Net TIC Flows, prior $33.8b; Net Long-term TIC Flows, prior $57.5b
DB’s Jim Reid concludes the overnight wrap
Happy Boxing Valentine’s Day. My wife went to bed at 7pm last night with the twins to desperately try to catch up on sleep while I watched a rampant Liverpool win 5-0 away from home in Europe on the telly, with Bloomberg TV on my iPad alongside me to catch up with the post CPI rally. A question for long time married readers though is when does romance come back into a marriage after having children?
Anyway yesterday was one of those days where having the most important data release ahead of time probably wouldn’t have helped you much. In fact it may have helped you lose money in risk. The well above expectations number for CPI was negative for bonds – as you would have expected – but equities rallied hard (S&P 500 +1.34%) after a large sell off in the minutes following the release (S&P futures slumped c.-1.8%). The price action yesterday perhaps tells us that the normalisation from last week’s vol shock is more powerful for markets for now than the data. However if this inflation trend holds (as has been and still is our expectation) we’re in for some real fun and games in markets in 2018 once the dust settles.
To be fair, weaker US retail sales (more details later) may have confused the story somewhat but it was all about inflation. For core, once we added in the extra decimal places the number came in at +0.349% putting clear air over the consensus estimate for just +0.2% and nearly rounding up to 0.4% MoM. In fact that was the largest monthly climb since March 2005 and kept the YoY steady at +1.8% (+1.7% expected). The three-month annualized rate also jumped to the highest since 2011 (+2.9%) and the six-month annualized rate also hit the highest since 2008 (+2.6%). The underlying components appeared to also affirm that inflation was relatively broad-based while there was a similar beat at the headline level (+0.5% mom vs. +0.3% expected).
Treasury yields marched higher with 10 year yields +7.3bp higher on the day to 2.903%, but c9bp up from just before the release. 2 and 30yr yields were up 6.1 and 5.1bps on the day. A reminder that yesterday we published a note (link) showing asset prices in the first and second half of the 1960s using our economists’ framework that there are big similarities between the inflection point on inflation in the 1960s and the current day.
In terms of US equities, sectors such as Banks (+2.55%), tech (+1.95%) and energy (+1.40%) led the rally. The VIX also swung c7pts intraday to close 5.7pts lower at 19.26. As we said earlier perhaps this current vol normalisation trend held sway yesterday but if inflation continues like this it feels impossible for us to imagine vol settling back down around 10 for a persistent period. We are likely to have some big trading days this year.
This morning in Asia, markets are extending on the positive US lead. The Nikkei (+1.21%) and Hang Seng (+1.97%) are up as we type, while the Chinese markets are now closed until the 21st for the lunar New Year holidays. After the bell in the US, Cisco’s share price jumped c7% after guiding to higher than expected sales for the current quarter and plans to boost its share buybacks by $25bn. Elsewhere, the YEN rose for the fourth straight day (+0.4%), partly helped by Japan’s Finance minister Aso prior comments where he noted “the current situation doesn’t warrant special intervention. The Yen isn’t rising or falling abruptly”.
Now recapping other markets performance from yesterday. European bourses initially traded lower post the US CPI print, but recovered throughout the day to be up c1%, partly aided by sound corporate results and supportive GDP prints. The Stoxx 600 (+1.07%), DAX (+1.17%) and FTSE (+0.64%) were all up and only the energy sector was in the red within the Stoxx. The VSTOXX fell 20% to 20.71. Over in government bonds, 10y Bunds and Gilts yields rose 0.7bp and 2.1bp respectively, while peripherals partly recovered from the prior day losses with yields down 1-6bp. Turning to currencies, the US dollar index weakened for the third consecutive day (-0.65%), while both the Euro and Sterling gained c0.8%. Elsewhere, the South African Rand was up 2.1% following President Zuma’s resignation. In commodities, WTI oil rebounded 2.38% to $60.60/bbl, in part as the latest EIA report showed US crude stockpiles rose less than expected last week. Precious metals gained c1.6% (Gold +1.59%; Silver +1.67%) and other LME base metals increased as the USD continues to fall (Copper +2.50%; Zinc +2.80%; Aluminium +1.80%).
Away from the markets, President Trump said he supports a 25c per gallon increase in federal gasoline and diesel taxes to help pay for upgrading roads, bridges and other public works. So perhaps there is more potential to fund his $1.5bln infrastructure plans, although Republican Senator Grassley noted the tax hike was unlikely to come up for a vote in the Senate and that “he’ll never get it by (Senator) McConnell”.
Staying in the US, our economists have been highlighting the upside risks to their growth outlook for some time. Given the recent passage of a bipartisan budget agreement provides for c$300 billion in additional discretionary spending over the next two years, they have now raised their 2018 real GDP growth forecast (Q4/Q4) to 2.9% (+0.3ppt) and the 2019 forecast rises to 2.5% (+0.4ppt). Following on, stronger growth should put further downward pressure on the unemployment rate, which they now expect will trough at 3.2% in 2019, about 1.5ppt below NAIRU. On rates, their views are unchanged and they continue to expect four rate hikes this year and three next year. But recent developments have tilted the balance of risks to the upside.
Now turning to some of the Brexit headlines. Foreign secretary Boris Johnson seemed to support the status quo during the Brexit transition period by noting “things will remain as they are”. However, he does make a case for a clean break with the EU – leaving the single market and customs union and pursuing flexibility for the UK to choose which EU rules it wants to keep post Brexit. Elsewhere, he noted “Theresa” was the right PM for the UK to lead Brexit talks while also indicating “let’s not go there” in terms of a potential second referendum on Brexit. On the other side, the EC’s Juncker’s response was quite colourful, he noted some in British politics “are against the truth, pretending that I’m a stupid, stubborn federalist…that I’m in favour of the EU superstate”, but “I’m strictly against (a superstate)….we aren’t the United States of America, we are the EU…”.
In Germany, Ms Merkel reiterated that the “black zero” fiscal prudence is the trademark of the CDU and “it will remain so in the future”. She noted that “if the SPD occupy the Finance Ministry in the future, our budget lawmakers will have to be even more careful that they don’t pile on new debt”.
Before we take a look at today’s calendar, we wrap up with other data releases from yesterday. In the US, the core CPI for January was above market at 0.3% mom (vs. 0.2%) as discussed earlier. Price increases were well spread across the core CPI, but part of the CPI gain was from a 1.7% monthly increase in apparel prices, the biggest increase since 1990. Notably, retail sales missed expectations. In the details, headline retail sales was -0.3% mom (vs. +0.2% expected). Ex auto and gas sales (-0.2% mom vs. +0.3%) and control group sales (0.0% mom vs. +0.4% expected) were also accompanied by downward revisions to December sales. The data certainly suggested a weaker looking consumption profile to the start the year and will likely cause the street to reassess growth forecasts the current quarter. Indeed the Atlanta Fed slashed their Q1 forecast to 3.25% from 4% but be slightly careful as their could have been some post hurricanes payback here. Elsewhere, December business inventories slightly beat at 0.4% mom (vs. 0.3% expected).
The Euro area’s 4Q GDP was in line at 0.6% qoq and 2.7% yoy. Across the countries, Germany’s 4Q GDP was also in line and solid at 0.6% qoq while Italy was slightly lower than expected at 0.3% qoq (vs. 0.4%). Elsewhere, the Euro area’s December IP was above market at 0.4% mom (vs. 0.1%), while Germany’s final reading of the January CPI was unrevised at 1.4% yoy. In Sweden the Riksbank left its policy rate at -0.5% and continued to forecast a gradual tightening from the second half of this year.
Looking at the day ahead, the January PPI and IP, February empire manufacturing, February Philly Fed PMI, February NAHB housing market index and the latest weekly initial jobless claims readings are all due in the US. In Europe Q4 employment data in France and the December trade balance for the Euro area are due. The ECB’s Mersch and Praet are also slated to speak at an event in Paris. Nestle will report earnings.
xxxxxxxxxxxxxxxxxxxxxxxxxxxxxxxxxxxxxxxxxxxxxxxxxxxxxxxxxxx
Pics Of The Day


xxxxxxxxxxxxxxxxxxxxxxxxxxxxxxxxxxxxxxxxxxxxxxxxxxxxxxxxxxxxxxxxxx
Thank You Harvey Honored To Post Your Work Man !
https://www.silverdoctors.com/tag/harvey-organ/
xxxxxxxxxxxxxxxxxxxxxxxxxxxxxxxxxxxxxxxxxxxxxxxxxxxxxxxxxxx
Thank You Jesse http://jessescrossroadscafe.blogspot.com/
xxxxxxxxxxxxxxxxxxxxxxxxxxxxxxxxxxxxxxxxxxxxxxxxxxxxxxxxxxx
Thank You GATA http://www.gata.org/
xxxxxxxxxxxxxxxxxxxxxxxxxxxxxxxxxxxxxxxxxxxxxxxxxxxxxxxxxxx
Thank You from MMgys The Love Network <3
xxxxxxxxxxxxxxxxxxxxxxxxxxxxxxxxxxxxxxxxxxxxxxxxxxxxxxxxxxx
Visit our Friends at GOLDBUGS INDEX https://investorshub.advfn.com/GOLDBUGS-Gold-Spot-(FOREX-XAUUSDO)-COM-GC-Z15-3386/
xxxxxxxxxxxxxxxxxxxxxxxxxxxxxxxxxxxxxxxxxxxxxxxxxxxxxxxxxxx
and Thank You All for Being With Us Tonight
Hoping You Have Nice Blue Sky Friday <3
MMgys
xxxxxxxxxxxxxxxxxxxxxxxxxxxxxxxxxxxxxxxxxxxxxxxxxxxxxxxx
Tucson Gem & Mineral Show (Last Week)
Worlds Largest Gem Show! Tucson Gem Show 2018
https://www.youtube.com/watch?v=xKpeJLjLXe4
http://www.tgms.org/calendar/2017/10/17/tucson-gem-mineral-society-present
.jpg)
Join the InvestorsHub Community
Register for free to join our community of investors and share your ideas. You will also get access to streaming quotes, interactive charts, trades, portfolio, live options flow and more tools.

