


Saturday, February 03, 2018 10:17:40 AM
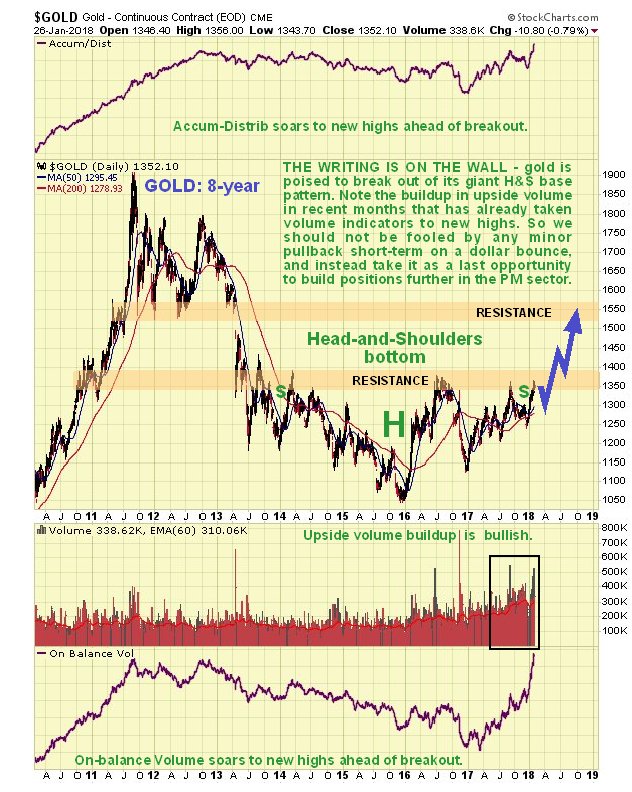
indicators concurrently is very bullish indeed—it means that
gold is destined to break out upside from this pattern into
a bull market soon.
Regardless of what efforts the supposed "cartel" with their paper
shenanigans make to stop it, and it's not hard to see why given
how much physical has been mopped up in recent years by countries such
as China, that understand gold's true value.
Upon breaking above the nearby band of resistance,
the first target for gold is the quite strong resistance
in the $1520–$1560 area.
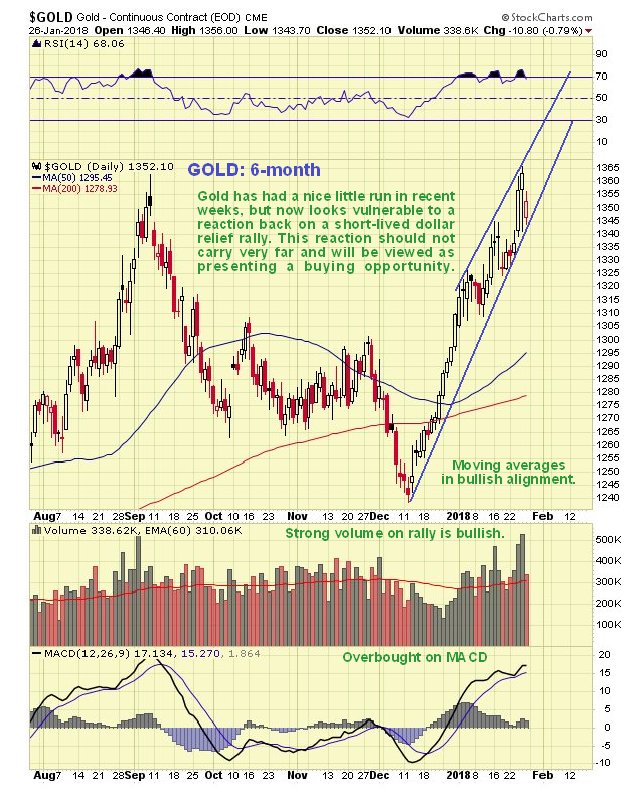
On $GOLD's 6-month chart, however, we can see that it has had a nice run
in recent weeks that has resulted in it becoming rather extended, and
with sentiment readings now very bullish, we should not be surprised
to see a modest pullback that would probably be occasioned by a relief
rally in the dollar to alleviate its oversold condition.
We can use any such pullback to do additional buying, especially of
gold and silver stocks.
https://investorshub.advfn.com/boards/read_msg.aspx?message_id=137958353
https://investorshub.advfn.com/boards/read_msg.aspx?message_id=138179706
https://investorshub.advfn.com/boards/read_msg.aspx?message_id=138142316
God Bless America

My opinions are my own and and DD I post should be confirmed as unbiased
Recent ARMN News
- Form F-X - Appointment of Agent for Service of Process and Undertaking • Edgar (US Regulatory) • 09/25/2024 09:07:26 PM
- Form F-10 - Registration Statement for Securities of certain Canadian Issuers. • Edgar (US Regulatory) • 09/25/2024 08:37:38 PM
- ARIS MINING PUBLISHES ITS 2023 SUSTAINABILITY REPORT • PR Newswire (US) • 08/22/2024 11:17:00 PM
- ARIS MINING PUBLISHES ITS 2023 SUSTAINABILITY REPORT • PR Newswire (Canada) • 08/22/2024 11:17:00 PM
- ARIS MINING REPORTS H1 2024 NET EARNINGS OF $5.0M, ADJUSTED EARNINGS OF $18.1M ($0.12/SHARE) AND EBITDA OF $53.2M WHILE SEGOVIA EXPANSION AND CONSTRUCTION OF MARMATO LOWER MINE REMAIN ON TRACK • PR Newswire (Canada) • 08/13/2024 09:01:00 PM
- ARIS MINING REPORTS H1 2024 NET EARNINGS OF $5.0M, ADJUSTED EARNINGS OF $18.1M ($0.12/SHARE) AND EBITDA OF $53.2M WHILE SEGOVIA EXPANSION AND CONSTRUCTION OF MARMATO LOWER MINE REMAIN ON TRACK • PR Newswire (US) • 08/13/2024 09:01:00 PM
- ARIS MINING ANNOUNCES HIGH GRADE DRILL RESULTS FROM ONGOING SEGOVIA OPERATIONS EXPLORATION PROGRAM • PR Newswire (US) • 08/12/2024 09:00:00 PM
- ARIS MINING ANNOUNCES HIGH GRADE DRILL RESULTS FROM ONGOING SEGOVIA OPERATIONS EXPLORATION PROGRAM • PR Newswire (Canada) • 08/12/2024 09:00:00 PM
- ARIS MINING REPORTS H1 2024 PRODUCTION, PROVIDES EXPANSION PROJECTS UPDATE AND REAFFIRMS FULL YEAR 2024 GUIDANCE • PR Newswire (Canada) • 07/16/2024 09:00:00 PM
- ARIS MINING REPORTS H1 2024 PRODUCTION, PROVIDES EXPANSION PROJECTS UPDATE AND REAFFIRMS FULL YEAR 2024 GUIDANCE • PR Newswire (US) • 07/16/2024 09:00:00 PM
- ARIS MINING COMPLETES ACQUISITION TO INCREASE OWNERSHIP IN SOTO NORTE GOLD-COPPER PROJECT TO 51% • PR Newswire (Canada) • 06/28/2024 12:40:00 PM
- ARIS MINING COMPLETES ACQUISITION TO INCREASE OWNERSHIP IN SOTO NORTE GOLD-COPPER PROJECT TO 51% • PR Newswire (US) • 06/28/2024 12:40:00 PM
- ARIS MINING TO INCREASE OWNERSHIP IN SOTO NORTE PROJECT TO 51% AND COMMENCES STUDY TO ASSESS NEW DEVELOPMENT PLAN • PR Newswire (US) • 05/23/2024 11:00:00 AM
- ARIS MINING TO INCREASE OWNERSHIP IN SOTO NORTE PROJECT TO 51% AND COMMENCES STUDY TO ASSESS NEW DEVELOPMENT PLAN • PR Newswire (Canada) • 05/23/2024 11:00:00 AM
- Form 6-K - Report of foreign issuer [Rules 13a-16 and 15d-16] • Edgar (US Regulatory) • 05/16/2024 09:00:29 PM
- ARIS MINING ANNOUNCES RESULTS OF ANNUAL GENERAL MEETING • PR Newswire (Canada) • 05/16/2024 09:00:00 PM
- ARIS MINING ANNOUNCES RESULTS OF ANNUAL GENERAL MEETING • PR Newswire (US) • 05/16/2024 09:00:00 PM
- ARIS MINING REPORTS Q1 2024 RESULTS WITH SEGOVIA GENERATING $13.8 MILLION IN OPERATING CASH FLOW • PR Newswire (Canada) • 05/14/2024 09:47:00 PM
- ARIS MINING REPORTS Q1 2024 RESULTS WITH SEGOVIA GENERATING $13.8 MILLION IN OPERATING CASH FLOW • PR Newswire (US) • 05/14/2024 09:47:00 PM
- Form 6-K - Report of foreign issuer [Rules 13a-16 and 15d-16] • Edgar (US Regulatory) • 05/14/2024 08:24:45 PM
- ARIS MINING Q1 PRODUCTION ON TRACK TO DELIVER FULL YEAR 2024 GUIDANCE WHILE EXPANSION PROJECTS ADVANCE • PR Newswire (US) • 04/15/2024 09:00:00 PM
- ARIS MINING Q1 PRODUCTION ON TRACK TO DELIVER FULL YEAR 2024 GUIDANCE WHILE EXPANSION PROJECTS ADVANCE • PR Newswire (Canada) • 04/15/2024 09:00:00 PM
- ARIS MINING ANNOUNCES APPOINTMENT OF RICHARD ORAZIETTI AS CFO AND OLIVER DACHSEL AS SVP, CAPITAL MARKETS • PR Newswire (US) • 04/08/2024 11:00:00 AM
- ARIS MINING ANNOUNCES APPOINTMENT OF RICHARD ORAZIETTI AS CFO AND OLIVER DACHSEL AS SVP, CAPITAL MARKETS • PR Newswire (Canada) • 04/08/2024 11:00:00 AM
- ARIS MINING REPORTS 2023 RESULTS WITH GUIDANCE ACHIEVED, NET EARNINGS OF $11.4M, ADJUSTED EARNINGS OF $52.2M ($0.38/SHARE), ADJUSTED EBITDA OF $159M • PR Newswire (Canada) • 03/06/2024 11:26:00 PM
North Bay Resources Announces Assays up to 5 oz/ton Gold, 1.5 oz/ton Platinum, 0.5 oz/ton Palladium, and 0.5 oz/ton Rhodium at Mt. Vernon Gold Mine, Sierra County, California • NBRI • Oct 4, 2024 9:15 AM
Basanite, Inc. Appoints Ali Manav as Interim Chief Executive Officer • BASA • Oct 3, 2024 9:15 AM
Integrated Ventures Announces Launch of MedWell Facilities, LLC and Lease Agreement with Giant Fitness Clubs • INTV • Oct 3, 2024 8:45 AM
Beyond the Horizon: Innovative Drug Combinations Offer New Hope for Alzheimer's and More • NVS • Oct 3, 2024 8:45 AM
SMX and FinGo Enter Into Collaboration Mandate to Develop a Joint 'Physical to Digital' Platform Service To Enhance Natural Rubber Industry's Ability to Report on Sustainable and Ethical Supply Chains • SMX • Oct 3, 2024 7:00 AM
Transforming Alzheimer's Treatment: Innovative Combinations to Boost Cognition • PFE • Oct 2, 2024 9:00 AM

