


| Followers | 689 |
| Posts | 143817 |
| Boards Moderated | 35 |
| Alias Born | 03/10/2004 |
Saturday, January 20, 2018 10:02:12 AM
CoT: Peek Into Future Through Futures – How Hedge Funds Are Positioned
By Hedgopia | January 20, 2018
Following futures positions of non-commercials are as of January 16, 2018.
E-mini S&P 500: Currently net long 122.5k, up 45k.
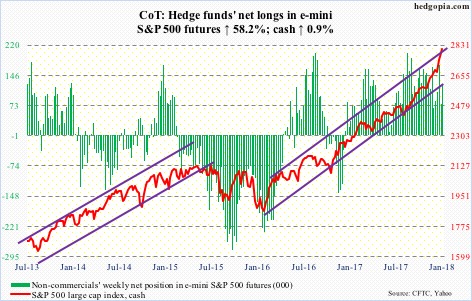
Tuesday saw the cash (2810.30) gap up to a new all-time high but only to close in the red. There was no confirmation of the potentially bearish action in the subsequent sessions, but the next two sessions were inside days, which, until proven otherwise, can both be a continuation or reversal pattern.
The weekly chart has developed a potentially bearish hanging man.
In the meantime, the sell-side sharply revised 2018 earnings estimates higher, and in the week through Wednesday, U.S.-based equity funds (including ETFs) took in another $9.1 billion. This followed inflows of $12 billion in the prior week (courtesy of Lipper).
In the same week, $4.7 billion went into SPY (SPDR S&P 500 ETF), while VOO (Vanguard S&P 500 ETF) and IVV (iShares core S&P 500 ETF) attracted $255 million and $236 million, in that order (courtesy of ETF.com).
Nasdaq 100 index (mini): Currently net long 25.4k, up 9.2k.
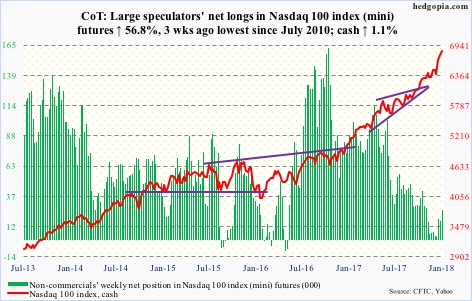
Tuesday’s action on the cash (6834.33) was potentially a dark cloud cover, but there was no confirmation.
For now, the bears continue to struggle to make a dent in the prevailing bullish momentum.
For whatever it is worth, the monthly RSI (14) on the Nasdaq 100 currently stands at 84.52 – the highest since March 2000.
Unlike in the prior week when QQQ (PowerShares QQQ ETF) gained $1.8 billion, in the week through Wednesday it lost $424 million (courtesy of ETF.com).
Russell 2000 mini-index: Currently net long 41.9k, up 6.5k.
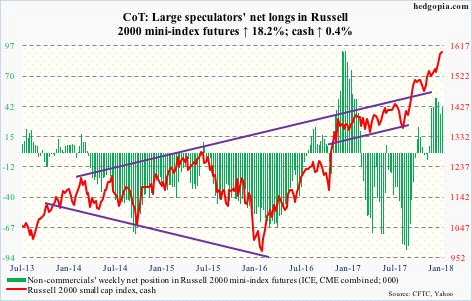
Of major U.S. equity indices, small-caps act the weakest. The cash was only up 0.4 percent for the week. That said, the bulls did manage to defend the 10-day on Friday.
Ahead of this, in the week to Wednesday, $305 million moved into IWM (iShares Russell 2000 ETF). IJR (iShares core S&P small-cap ETF) took in another $87 million (courtesy of ETF.com).
US Dollar Index: Currently net short 1.3k, down 2.1k.
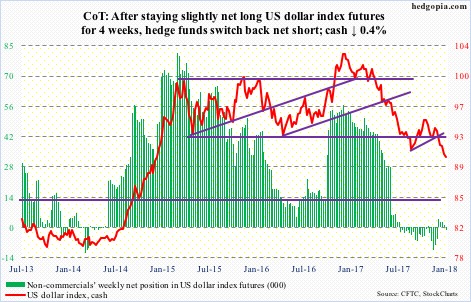
The cash (90.37) dipped under 90 – to 89.96 on Wednesday (and matched on Friday) – before finding its feet. Even if this is a bottom – likely – the dollar index needs to stabilize.
The daily lower Bollinger band continues to drop, as do shorter-term moving averages.
Non-commercials once again switched to net short, albeit only slightly.
Nearest resistance lies at 91, and then 91.50.
Worse, it drops to test support at 89.
VIX: Currently net short 82.2k, down 9.5k.
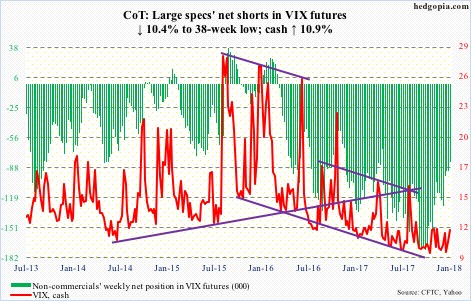
For the second week running, both the cash (11.27) and the S&P 500 rallied. This ordinarily does not happen.
Perhaps encouragingly for volatility bulls, VIX has remained above the 200-day – and the 50-day – for four sessions now.
That said, in 10 sessions VIX rallied just under four points to Wednesday’s high of 12.81. This, even as the S&P 500 rallied three-plus percent.
Thus the need for vol bulls to also be on the lookout for a spike reversal. In the past, such reversals led to quick unwinding of the daily overbought condition, which VIX is in currently.
https://hedgopia.com/cot-peek-into-future-through-futures-how-hedge-funds-are-positioned-36/
• DiscoverGold
Click on "In reply to", for Authors past commentaries
Information posted to this board is not meant to suggest any specific action, but to point out the technical signs that can help our readers make their own specific decisions. Your Due Dilegence is a must!
• DiscoverGold
Join the InvestorsHub Community
Register for free to join our community of investors and share your ideas. You will also get access to streaming quotes, interactive charts, trades, portfolio, live options flow and more tools.

