| Followers | 689 |
| Posts | 143817 |
| Boards Moderated | 35 |
| Alias Born | 03/10/2004 |
Thursday, January 18, 2018 8:50:25 AM
DP Alert: Market Overbought or the "New Normal"? - UUP H&S Executing As Expected
By Erin Swenlin | January 17, 2018
As we watch the SPX continue to move higher in parabolic fashion, it's of course natural to begin to worry about a market collapse. During today's MarketWatchers LIVE show, Tom and I went over what we think are good "alerts" to the bear market switchover. However, Carl made a great point in Friday's "Weekly Wrap" that we could be looking at a "new normal" as far as bull and bear markets are concerned.
Note the long-term monthly chart below. Monthly PMO SELL signals have worked quite well to warn of impending bear markets or corrections. When I talk about a "new normal", the monthly chart already shows some moves to "new normals". In the late 80's/90's where new all-time highs were set and the original 'trading range' of the SPX moved higher with looser fiscal policies and the "dot com" explosion. This could be what we're looking at right now with the tinder being a more business-friendly environment based on corporate taxes and an expanding economy. So when I say, "new normal", I'm talking about the establishment of a new very long-term trading range. Like the 90's, we could be seeing a similar type of "travel time" which means few corrections and no serious bear markets. The monthly PMO does keep us fairly safe along the way.
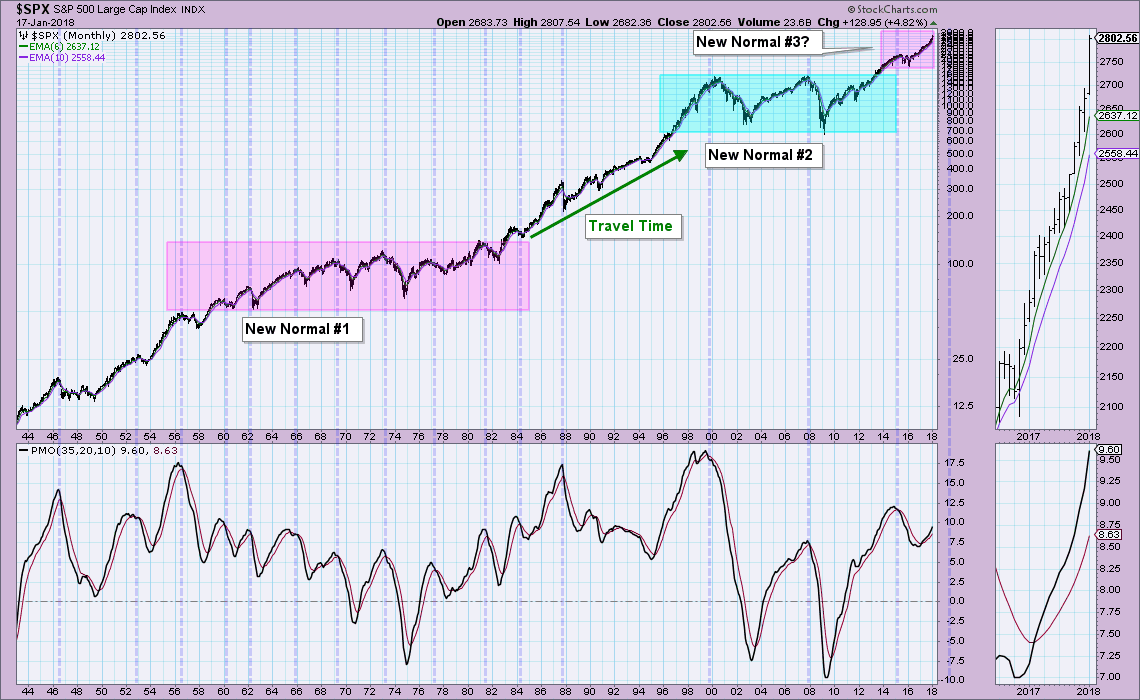
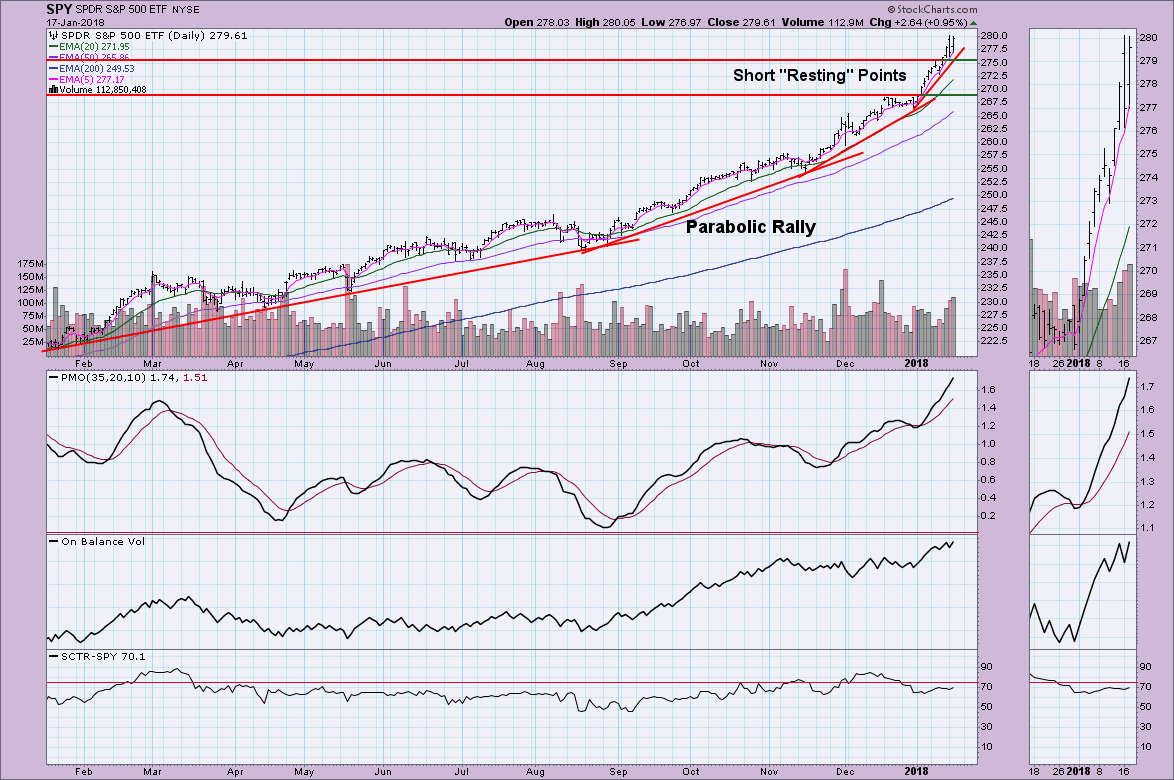
Given that we could be looking at a travel period to a new trading range, the parabolic chart pattern may not be as much of a problem after all. The market has had periods of 'rest' during this rise and even a few small pullbacks. I suggest that this could continue for a few more years or so, but we will likely see some more serious downturns along the way as the market does get stretched thin. In the shorter term, I'm concerned about the very overbought PMO.
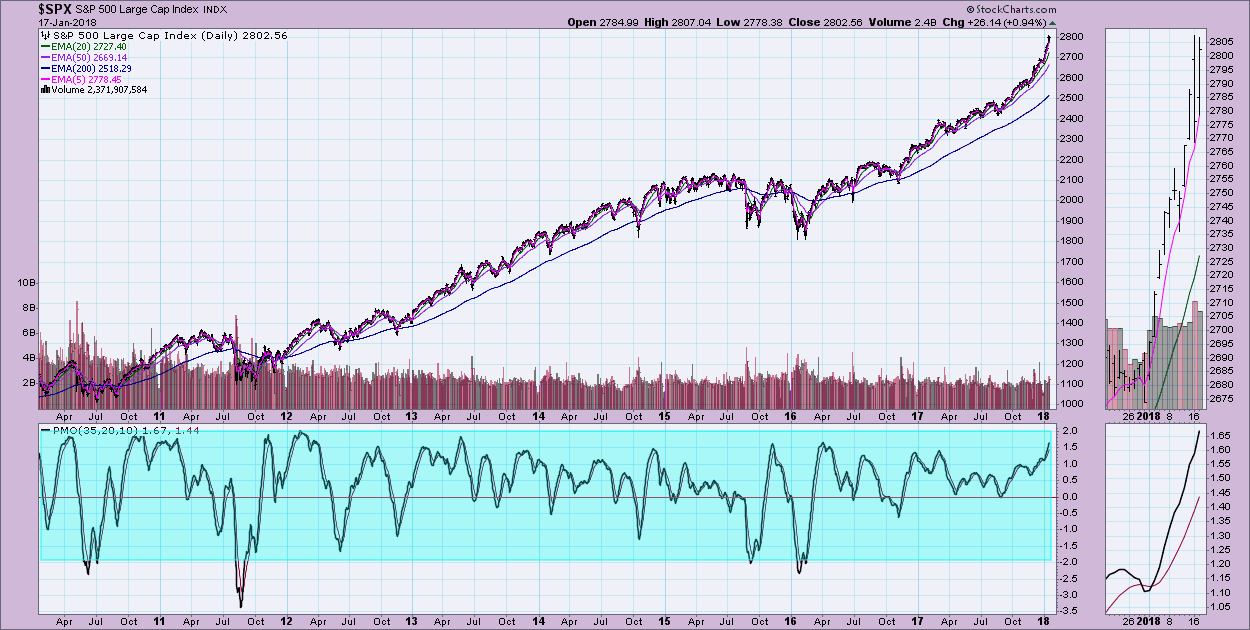
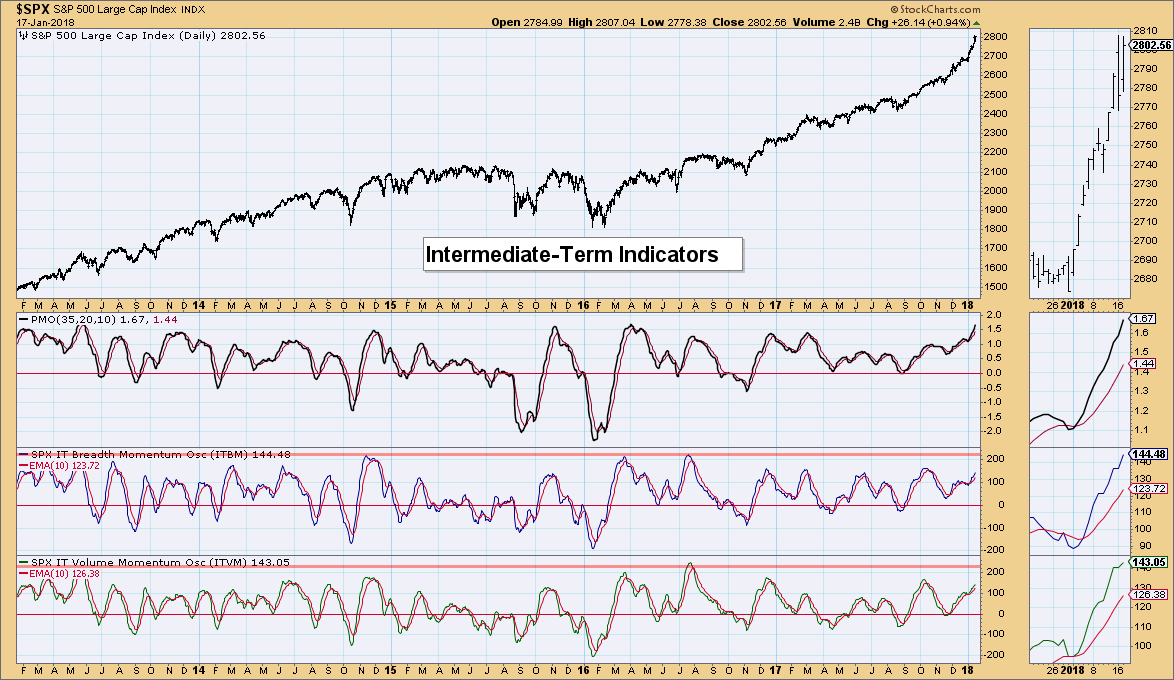
Below is a long-term daily chart so you can see what the normal range is for the PMO on the $SPX. A reading of +2 is overbought. However, the 'new normal' tells us that while the PMO is extended, a pullback or consolidation will be the likely reaction to bring it back down to the zero line.
Let's finish the discussion with a look at where indicators are pointing in the ultra-short term, short term and intermediate term. At this point, they are not pointing to a rapid drop.
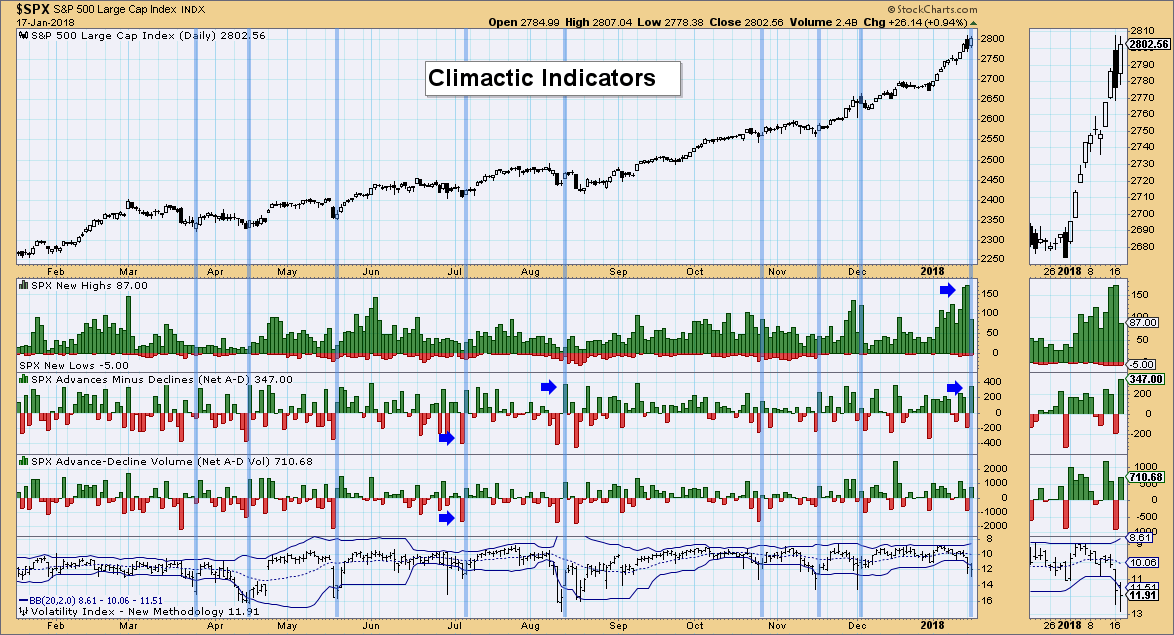
Climactic Indicators: I use an inverted scale on the VIX along with breadth numbers to analyze the very-short term or 'ultra-short term' as I like to call it. When the VIX penetrates the lower Bollinger Bands on the inverted scale, it signals bearish sentiment. Sentiment is contrarian, so I will typically look for bounces off these penetrations of the VIX Bollinger Bands. Today we saw a continuation of climactic readings with the VIX lower band still broken. I would look for a continuation of higher prices through the end of the week based on this chart.
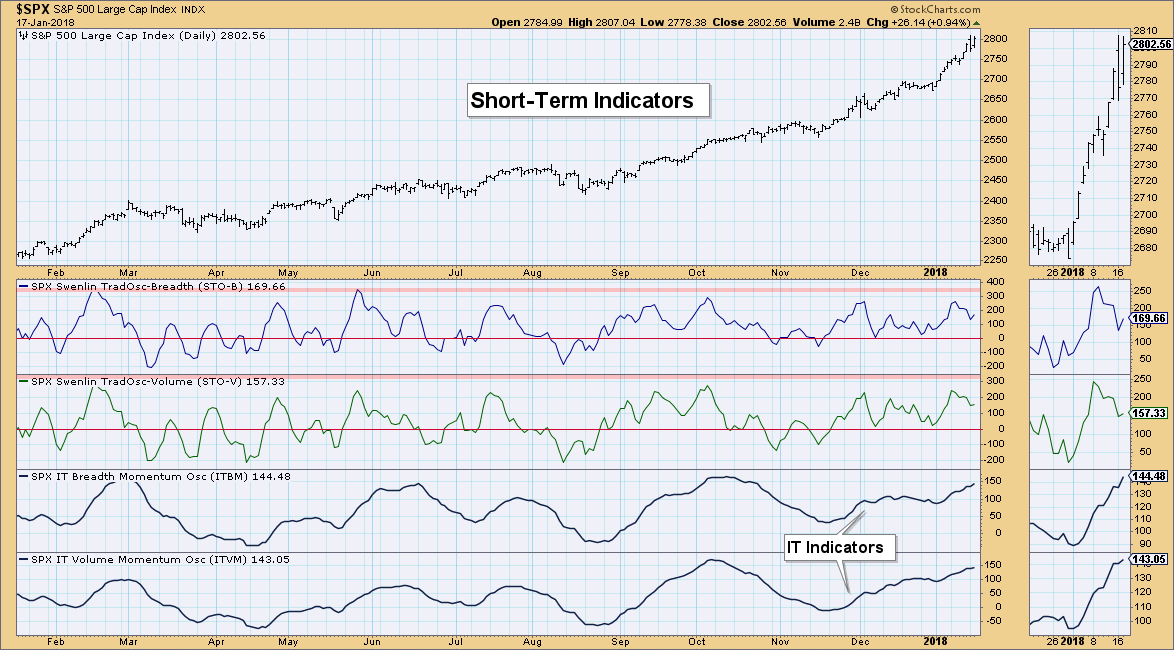
Short-Term Indicators: These indicators are trending lower, but it hasn't hurt price overall. It seems they are managing to unwind with the intermittent daily pullbacks even as price moves higher.
Intermediate-Term Indicators: These indicators are getting overbought, but we aren't seeing them turn lower yet. This is bullish for the intermediate term.
Conclusion: I would second the motion of Carl's that we are heading toward a new normal or new trading range overall as corporate America digests tax and regulation relief. This is NOT to say we will not see corrections or deeper pullbacks along the way, I would suggest that until prices reach extreme saturation or the top of the new trading range, an extended bear market isn't in the cards. We will watch the monthly PMO to get warning that time could be arriving. . .
* * *
http://stockcharts.com/articles/decisionpoint/2018/01/dp-alert-overbought-or-the-new-normal.html
• DiscoverGold
Click on "In reply to", for Authors past commentaries
By Erin Swenlin | January 17, 2018
As we watch the SPX continue to move higher in parabolic fashion, it's of course natural to begin to worry about a market collapse. During today's MarketWatchers LIVE show, Tom and I went over what we think are good "alerts" to the bear market switchover. However, Carl made a great point in Friday's "Weekly Wrap" that we could be looking at a "new normal" as far as bull and bear markets are concerned.
Note the long-term monthly chart below. Monthly PMO SELL signals have worked quite well to warn of impending bear markets or corrections. When I talk about a "new normal", the monthly chart already shows some moves to "new normals". In the late 80's/90's where new all-time highs were set and the original 'trading range' of the SPX moved higher with looser fiscal policies and the "dot com" explosion. This could be what we're looking at right now with the tinder being a more business-friendly environment based on corporate taxes and an expanding economy. So when I say, "new normal", I'm talking about the establishment of a new very long-term trading range. Like the 90's, we could be seeing a similar type of "travel time" which means few corrections and no serious bear markets. The monthly PMO does keep us fairly safe along the way.

Given that we could be looking at a travel period to a new trading range, the parabolic chart pattern may not be as much of a problem after all. The market has had periods of 'rest' during this rise and even a few small pullbacks. I suggest that this could continue for a few more years or so, but we will likely see some more serious downturns along the way as the market does get stretched thin. In the shorter term, I'm concerned about the very overbought PMO.

Below is a long-term daily chart so you can see what the normal range is for the PMO on the $SPX. A reading of +2 is overbought. However, the 'new normal' tells us that while the PMO is extended, a pullback or consolidation will be the likely reaction to bring it back down to the zero line.

Let's finish the discussion with a look at where indicators are pointing in the ultra-short term, short term and intermediate term. At this point, they are not pointing to a rapid drop.
Climactic Indicators: I use an inverted scale on the VIX along with breadth numbers to analyze the very-short term or 'ultra-short term' as I like to call it. When the VIX penetrates the lower Bollinger Bands on the inverted scale, it signals bearish sentiment. Sentiment is contrarian, so I will typically look for bounces off these penetrations of the VIX Bollinger Bands. Today we saw a continuation of climactic readings with the VIX lower band still broken. I would look for a continuation of higher prices through the end of the week based on this chart.

Short-Term Indicators: These indicators are trending lower, but it hasn't hurt price overall. It seems they are managing to unwind with the intermittent daily pullbacks even as price moves higher.

Intermediate-Term Indicators: These indicators are getting overbought, but we aren't seeing them turn lower yet. This is bullish for the intermediate term.

Conclusion: I would second the motion of Carl's that we are heading toward a new normal or new trading range overall as corporate America digests tax and regulation relief. This is NOT to say we will not see corrections or deeper pullbacks along the way, I would suggest that until prices reach extreme saturation or the top of the new trading range, an extended bear market isn't in the cards. We will watch the monthly PMO to get warning that time could be arriving. . .
* * *
http://stockcharts.com/articles/decisionpoint/2018/01/dp-alert-overbought-or-the-new-normal.html
• DiscoverGold
Click on "In reply to", for Authors past commentaries
Information posted to this board is not meant to suggest any specific action, but to point out the technical signs that can help our readers make their own specific decisions. Your Due Dilegence is a must!
• DiscoverGold
Join the InvestorsHub Community
Register for free to join our community of investors and share your ideas. You will also get access to streaming quotes, interactive charts, trades, portfolio, live options flow and more tools.


