Shark Break Coming On SPY? By: Tim Ord | November 6, 2017
• SPX Monitoring purposes; Neutral • Monitoring purposes GOLD: Covered short GDX at 23.23 on 10/20/17 =gain 2.56%; Short GDX on 10/13/17 at 23.84. • Long Term Trend monitor purposes: Neutral.
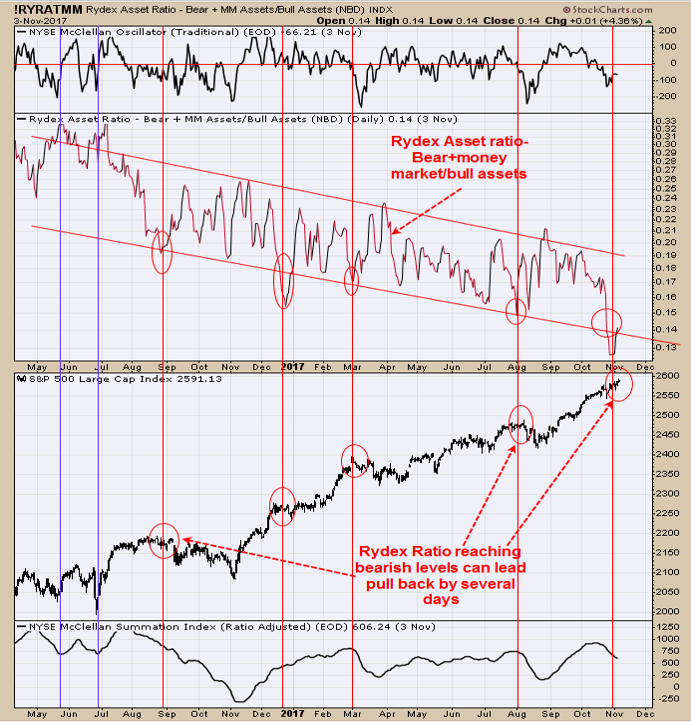
Above is the Rydex asset ratio – Bear + Money market/bull assets. The chart above goes back a year and seven months. When the Rydex ratio reached the lower trend line and turns up the market was near a short-term high. This signal can arrive early by several days pointed out with red arrows. According to history, November 6 had a probability of a higher close of 78.6% of the time (one of the strongest days of the year). Tomorrow’s probability is 42.9% higher. The probability favors a pull back. Patience is needed for now.
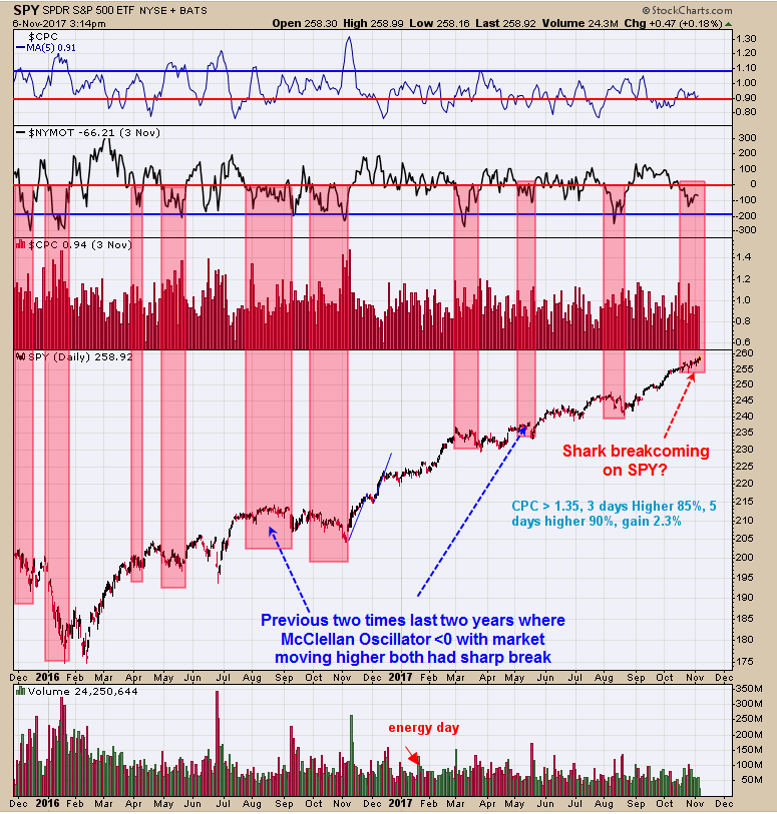
The chart above goes back two years and shows the times when the McClellan Oscillator was below “0”. In the case shown, the market did move lower at some point when the McClellan Oscillator was <”0”. The two times we pointed out with blue arrows shows the time where McClellan Oscillator was below “0” and for a short time the market still moved modestly higher but in the end still broke to new short-term lows. The current time noted in red is where we are now as the market is trading modestly higher and the McClellan Oscillator is staying below “0”. This is the week before option expiration and a week to be careful as whipsaws are common. Tomorrow is “turnaround Tuesday” and that suggests a high could be seen for this week. Also, the market seems to stall around 2600 on the SPX very near to (SPY 260). A pullback seems likely within the next two weeks. The 254 range is a possible target.
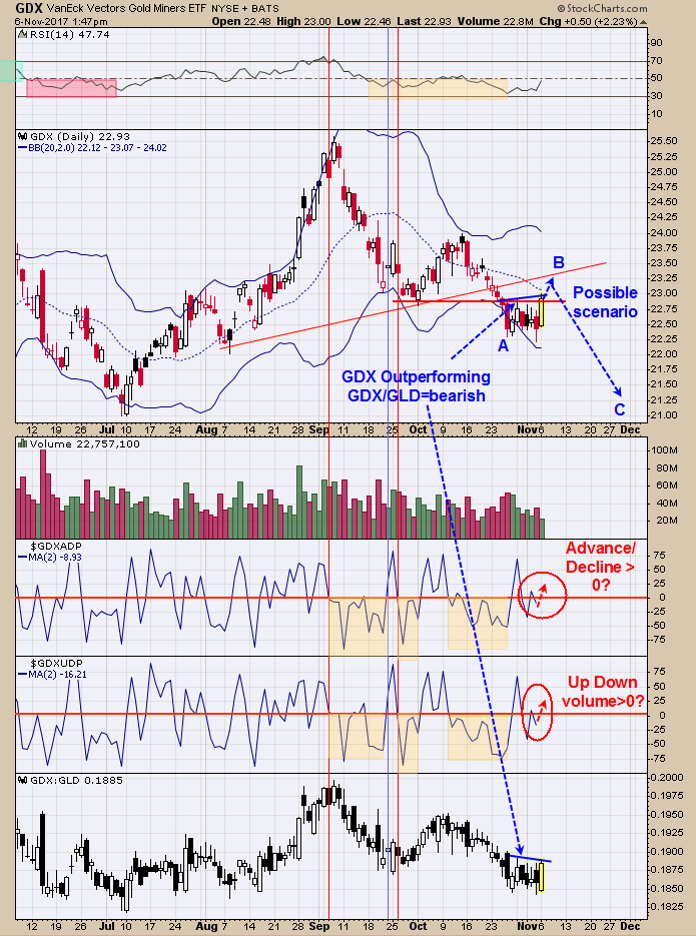
There is a cycle low due around December (+ or – a month). For very short-term, both Advance/Decline and Up/Down volume indicators where back below “0” on Friday’s close and they were bearish. With today’s GDX rally, both may be back above “0” and that is a bullish sign. These two indicators are updated several hours after the close and we won’t know the results until later tonight. The area of resistance on this potential bounce is near 23.25 which could represent a “B” wave high. The pattern is forming since the October high and it could be ABC with “C” having a measured target near 21.25 range. On today’s rally GDX made a higher high over the last several days trading, where GDX/GLD did not. GDX is outperforming GDX/GLD. With the Mid Bollinger Band trending down and the RSI below 50, the larger trend is still down. The COT commercials are still short around 211K and still in the bearish camp. Neutral for now on GDX.
Click on "In reply to", for Authors past commentaries
Information posted to this board is not meant to suggest any specific action, but to point out the technical signs that can help our readers make their own specific decisions. Your Due Dilegence is a must! • DiscoverGold
Register for free to join our community of investors and share your ideas. You will also get access to streaming quotes, interactive charts, trades, portfolio, live options flow and more tools.


 News
News  Market Data
  Discover