October: The Uptrend Appears Near An End Or Has Ended For Now By: Tim Ord | October 9, 2017
• SPX Monitoring purposes; Short SPX on 8/30/17 at 2457.59. • Monitoring purposes GOLD: Long GDX on 10/2/17 at 23.05 • Long Term Trend monitor purposes: Neutral.
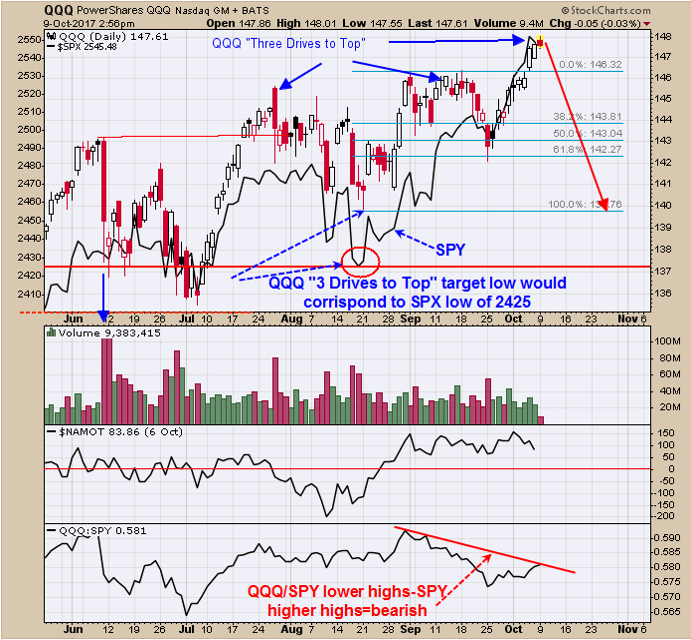
We have the candlestick QQQ chart overlaid with a line SPX chart. The QQQ chart could be drawing a “Three Drives to Top” pattern (same pattern that appears was forming on the SPY). This pattern normally has a 61.8% retracement off the second high on increased volume and matching what the current QQQ pattern did.If the “Three Drives to top” has formed on the QQQ than a pull back to where pattern began are the downside target which is near 137 on the QQQ and a target near 2425 on the SPX if the two indexes continue to rhyme. Short SPX on 8/30/17 at 2457.59.
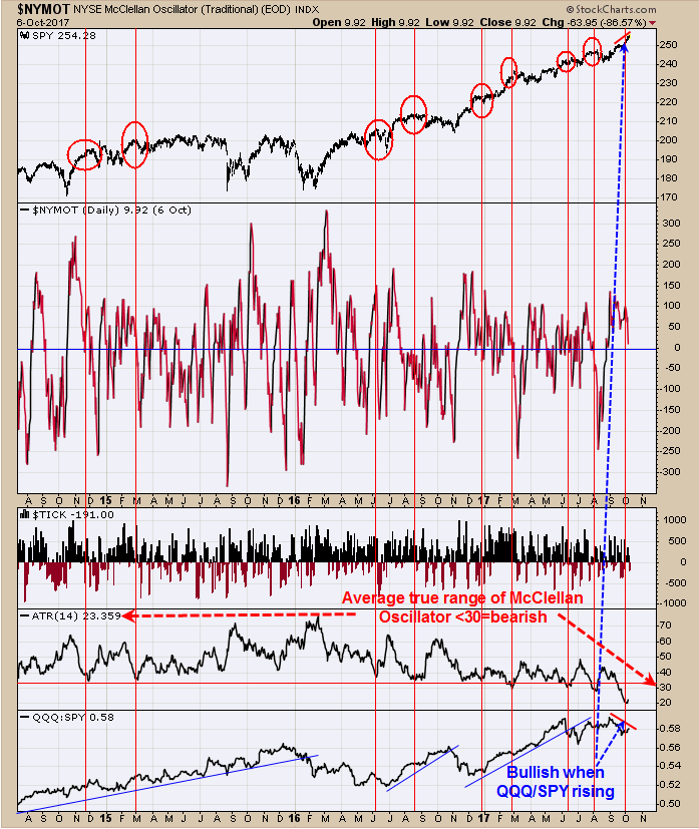
The second window up from the bottom is the “Average True range” (ATR) of the McClellan oscillator. Normally when ATR of the McClellan Oscillator reaches below 30 the market is near a short term high (identified with red vertical lines). Current reading is 23.359 up from 20.954. In most cases when the ATR turned up the top was in. We will have to wait and see on this go around if that statement hold true. The bottom window is the QQQ/SPY ratio. In general, when this ratio is rising (QQQ outperforming SPY) the markets are in bullish trends and vice versa. This ratio has made lower highs as SPY made higher highs and a negative divergence. The uptrend appears near an end or has ended for now. October has been down with years ending in 7 going back to 1907 and the SPY closed at 251.29 on the first trading day of the month suggesting SPY will be lower than that on the last trading day of the month. Short SPX on 8/30/17 at 2457.59.
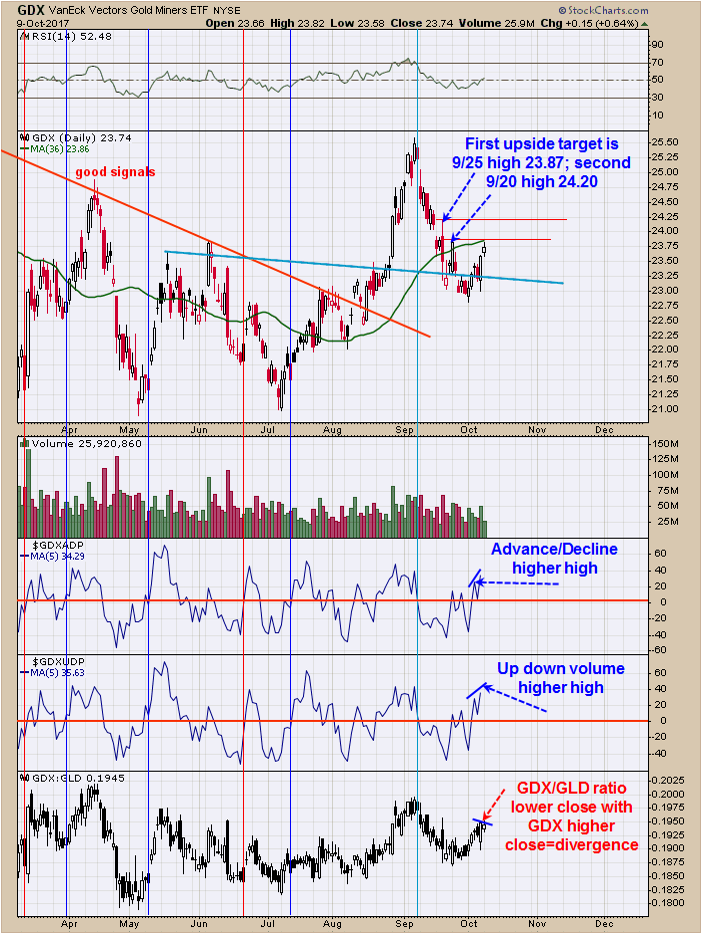
The Up down Volume percent indicator and the Advance/Decline Percent indicator (second and third windows up form bottom) both making higher highs and a bullish divergence. The bottom window is the GDX/GLD ratio which closed below its previous high as GDX closed about its previous high and a bearish divergence. If this bearish divergence carries on it could stall the GDX rise. We have two possible upside targets which are the September 25 high which is 23.87 (all most there) and the September 20 high of 24.20 which was a high volume day and most high volume days high are tested at some point. If the September 20 high volume day’s high is tested on light volume would suggest resistance and a short term bearish sign. This scenario may change and condition change in the market.. Long GDX on 10/2/17 at 23.05.
Click on "In reply to", for Authors past commentaries
Information posted to this board is not meant to suggest any specific action, but to point out the technical signs that can help our readers make their own specific decisions. Your Due Dilegence is a must! • DiscoverGold
Register for free to join our community of investors and share your ideas. You will also get access to streaming quotes, interactive charts, trades, portfolio, live options flow and more tools.


 News
News  Market Data
  Discover