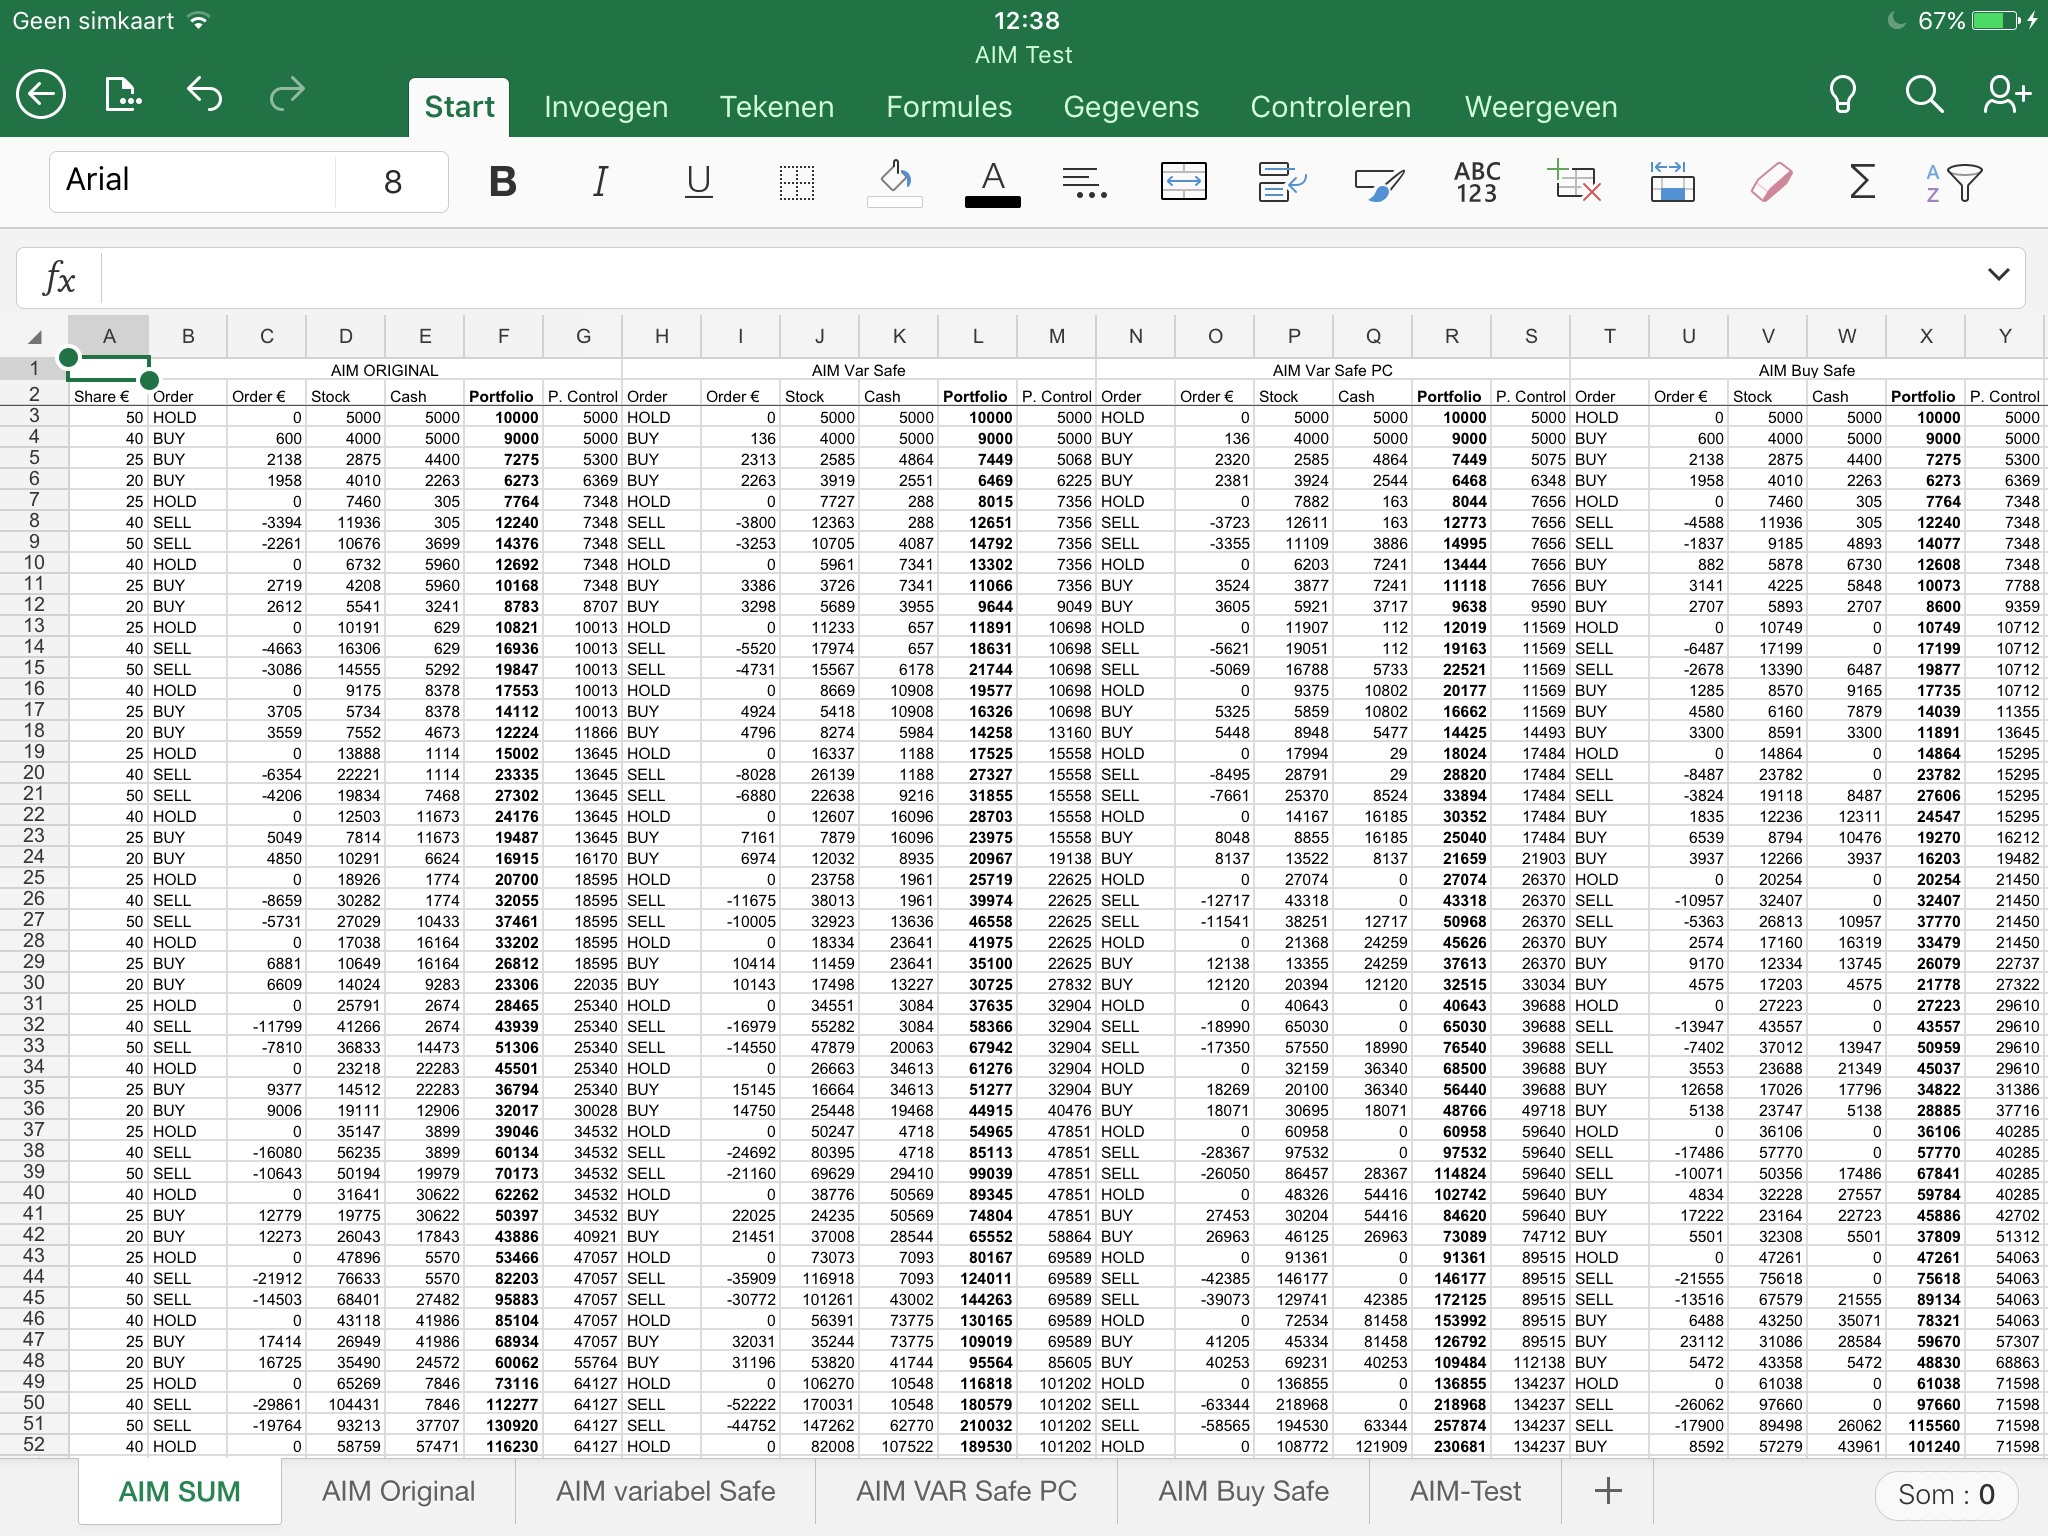
Hi all, Still a bit new to this board but have been reading along now for a couple of months. I see my story is similar to quite a few others. Read Lichello's book a long time ago, made an excel sheet based on that in that same period but didn't really get around to putting it in action for some reason. Recently dusted off the old spreadsheet and was curious again but couldn't find my old book anymore luckily it's also available on iBooks so now I have a digital version. Searched a bit on the internet and was surprised to find this board and that it's so actively used still, guess Lichello did something right! Also very nice to read that over time some improvements have been made, never heard about split Safe or Veallie's before. After dusting off the old spreadsheet I tried to implement some of the improvements in there. At the moment it's raising the PC when cash is equal to the Stock Value with every sell but currently only by 0.25 of the sell, so not really a Veallie but at least braking the cash growth a bit. About (the split) Safe I'm still struggling a bit. Especially with how large safe should be. It seems it's controlling for a large portion how Safe will operate and depends a lot on the volatility of the stock/fund. For now I made it a function of the max and min value of a stock. The bigger the difference between these values the bigger the safe. I was also wondering why 0% sell safe is working, and if it's working for selling especially at the top of the market isn't it than also working for a 0% buy safe at the bottom? Anyone ever tried this? I think I read a post here somewhere saying that you shouldn't do that but can't find it anymore. I tried to put it in my spreadsheet so now safe is variable, very low buy safe and high sell safe at the bottom and high buy safe with a low sell safe at the top. I have added a screenshot of a summary page of one of my spreadsheets showing the results of 4 AIM formula's. The first is standard AIM with 10% safe. Second, the variable safe. Third, variable safe with the raise of PC with each buy connected to the total safe Value (so not the standard 0,5*buy). Fourth, AIM with buy safe only set at 10%.... The column on the left is the input for the share price it's 50/20 which is similar to Lichello's 10/4, probably not very realistic but in this way I could compare it with the book (there are still some different values compared to the book but I guess that's due to rounding of numbers?)
Last thing I was wondering about is didn't I make something nice and simple too complicated...... :(
Register for free to join our community of investors and share your ideas. You will also get access to streaming quotes, interactive charts, trades, portfolio, live options flow and more tools.
 News
News  Market Data
  Discover