DP Alert: SPY Bounces Off Rising Bottoms Support By Erin Heim | August 22, 2017
SPY Bounces Off Rising Bottoms Support - IT Indicators Reaching Near-Term Oversold Territory
The market has been meandering lower this month since I left and consequently the DP indicators have seen some bearish changes. Let's get started with a fresh review.
STOCKS
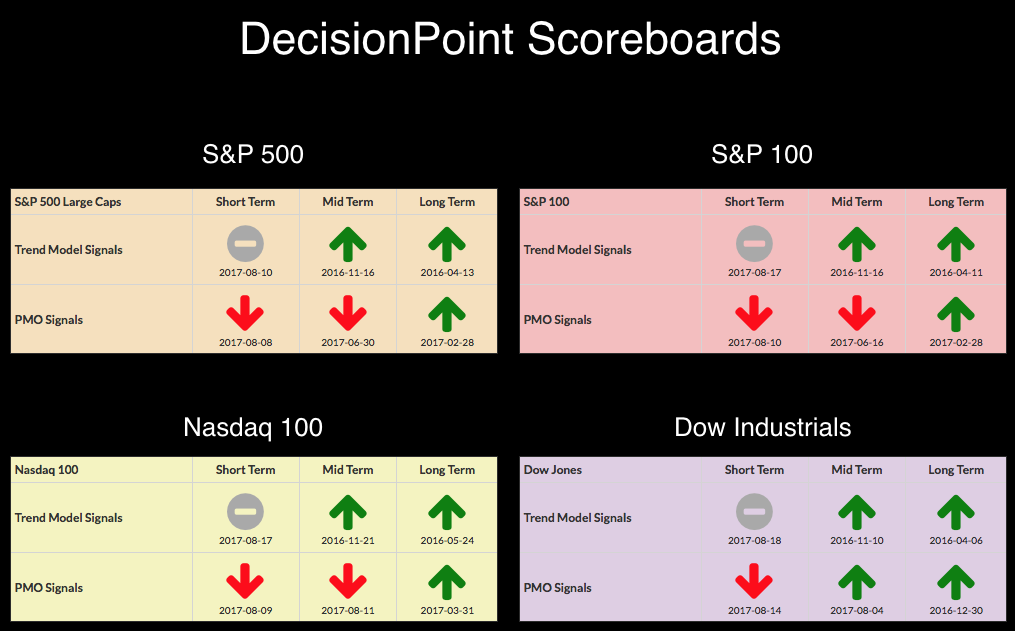
IT Trend Model: BUY as of 11/15/2016
LT Trend Model: BUY as of 4/1/2016
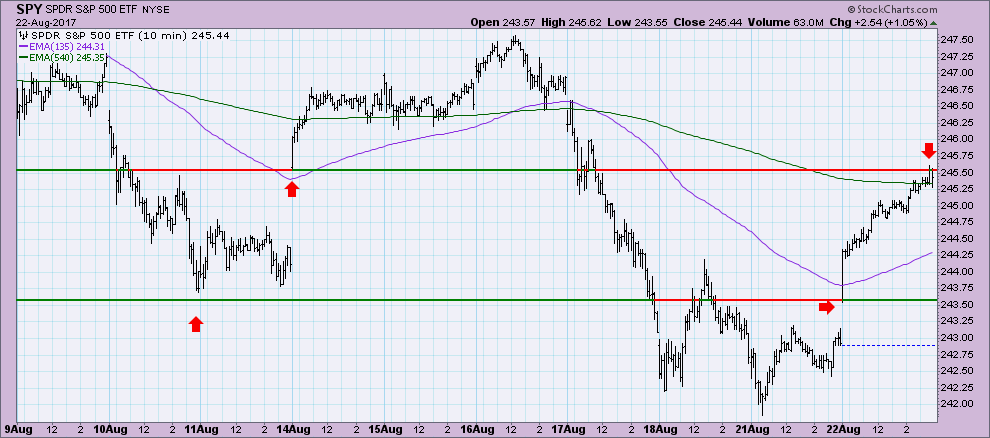
I note important gap support on the 10-minute bar chart. Today price gapped up through resistance at $243, but was stopped at gap resistance from August 14th.
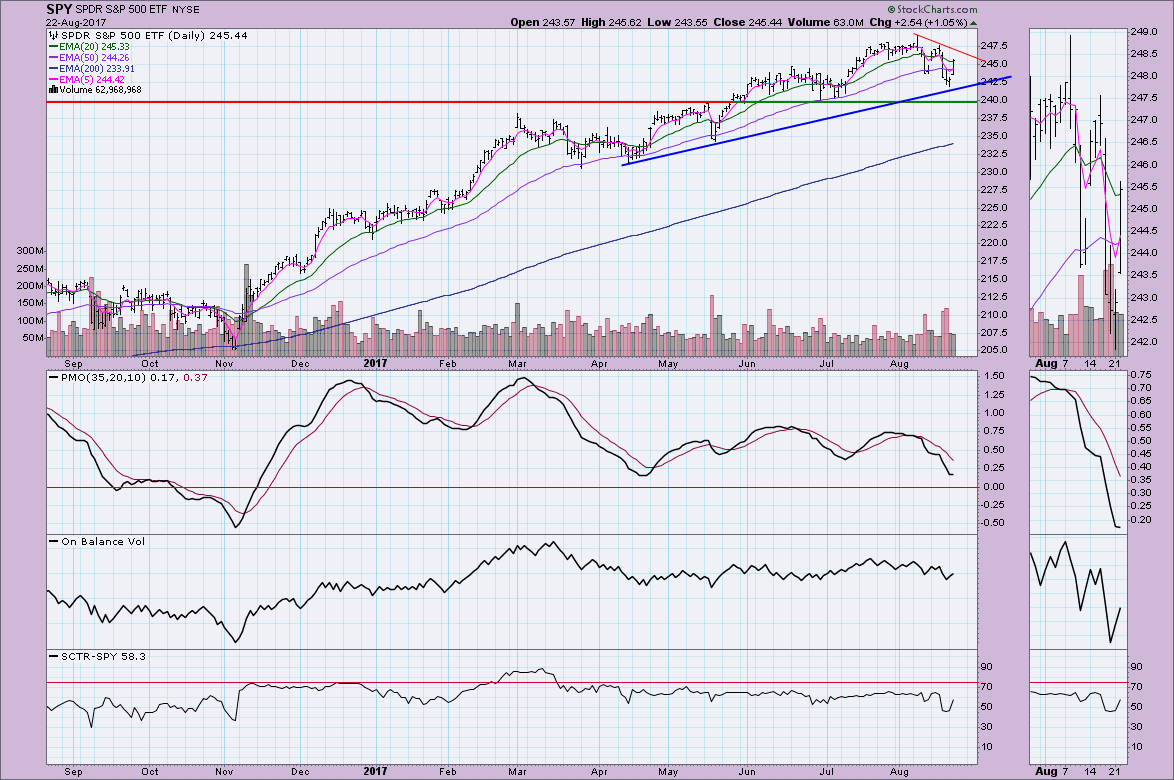
As I noted in today's headline, price bounced off rising bottoms support before it actually tested horizontal support at $240. The PMO was tugged upward in response to today's rally, though I'm not sure we will see much follow-through. You can see very short-term overhead resistance formed by the declining tops trendline drawn from all-time highs that will be the first hurdle. I like that the SCTR is responding positively, but volume was unimpressive on the day.
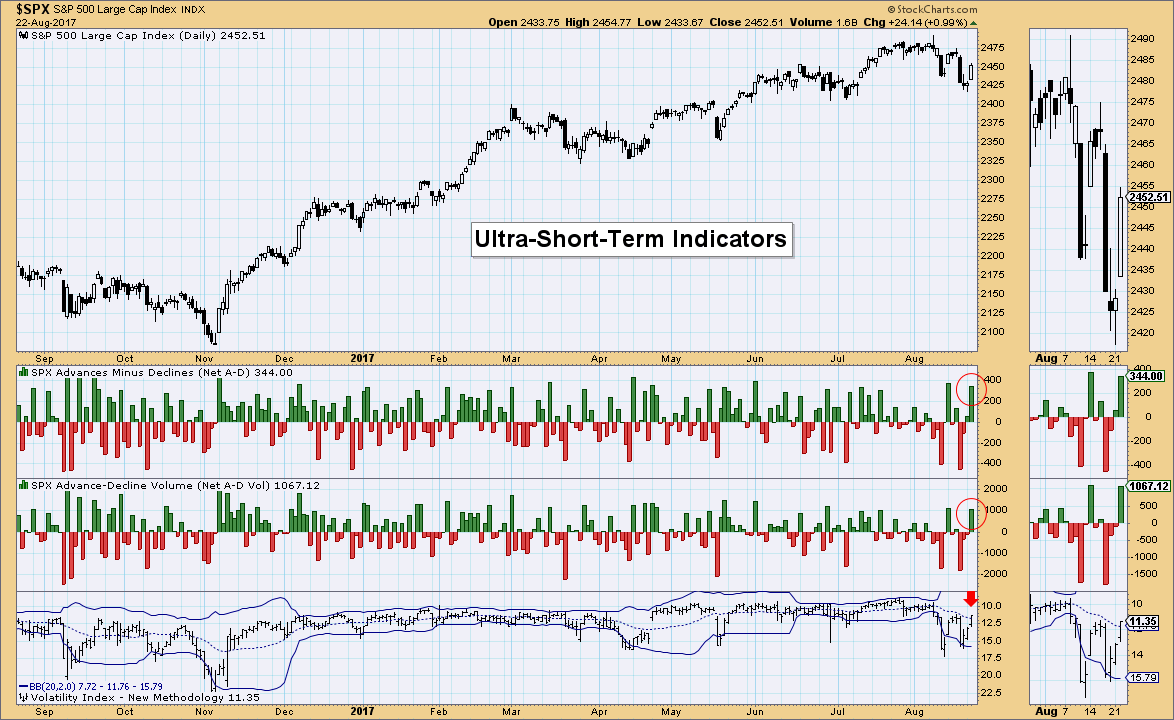
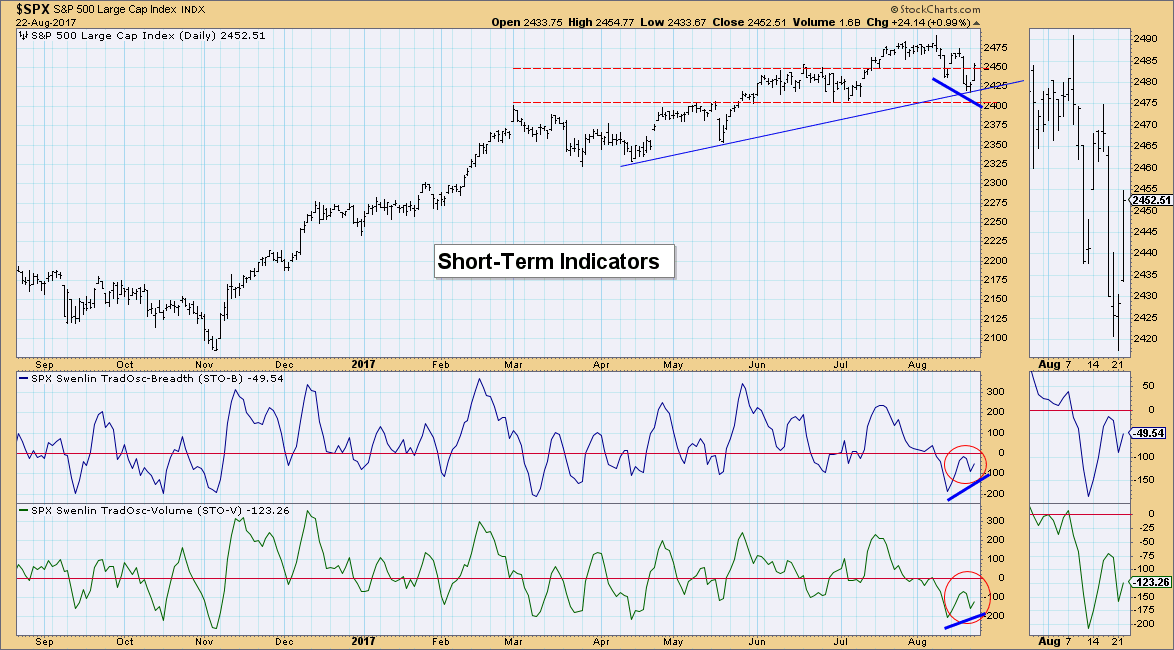
Ultra-Short-Term Indicators: We saw climactic breadth readings but not a comparable climactic reading on the VIX which remained tethered to its average. Consequently, I'm not looking at this as an exhaustion. It could be an initiation to higher prices, but without seeing the VIX pressing against either of its Bollinger Bands, I don't think we can really call these readings as an initiation or exhaustion.
Short-Term Indicators: I definitely do not like the inability of these indicators to penetrate the zero line. It is certainly encouraging to see them turn back up and there is a short-term positive divergence between indicator bottoms and price bottoms.
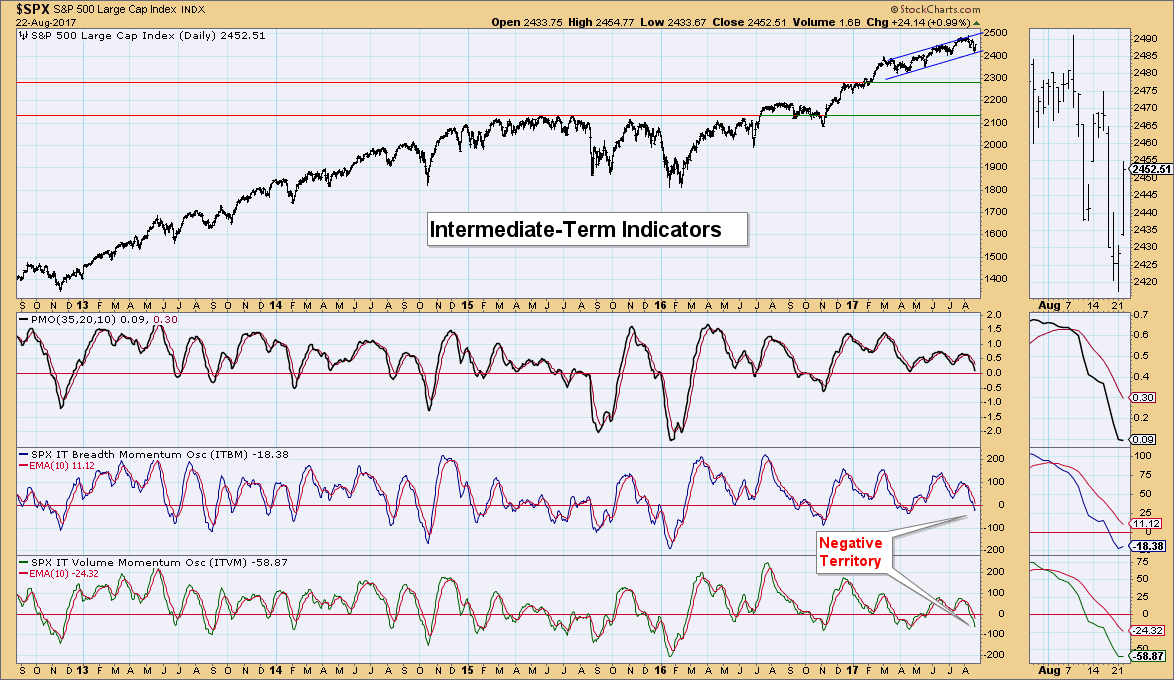
Intermediate-Term Indicators: These indicators turned up which is bullish, though I suspect this could be just another twitch. Good news is that they have reached near-term oversold territory. Of course we've seen much lower readings as in early 2016, but in the very bullish market experienced since the election, this does seem to be a good area for indicator reversals to the upside.
Conclusion: Today's rally was impressive and it managed to pull the indicators out of declines which is positive. I'd like to see a breakout above the short-term declining tops trendline on the SPY, but the market has been soft with a bearish leaning as seen with the current PMO SELL signals in place on all four of the Scoreboard indexes. I'll be watching intermediate-term indicators closely to see if they can get follow-through on the tick upward today.
DOLLAR
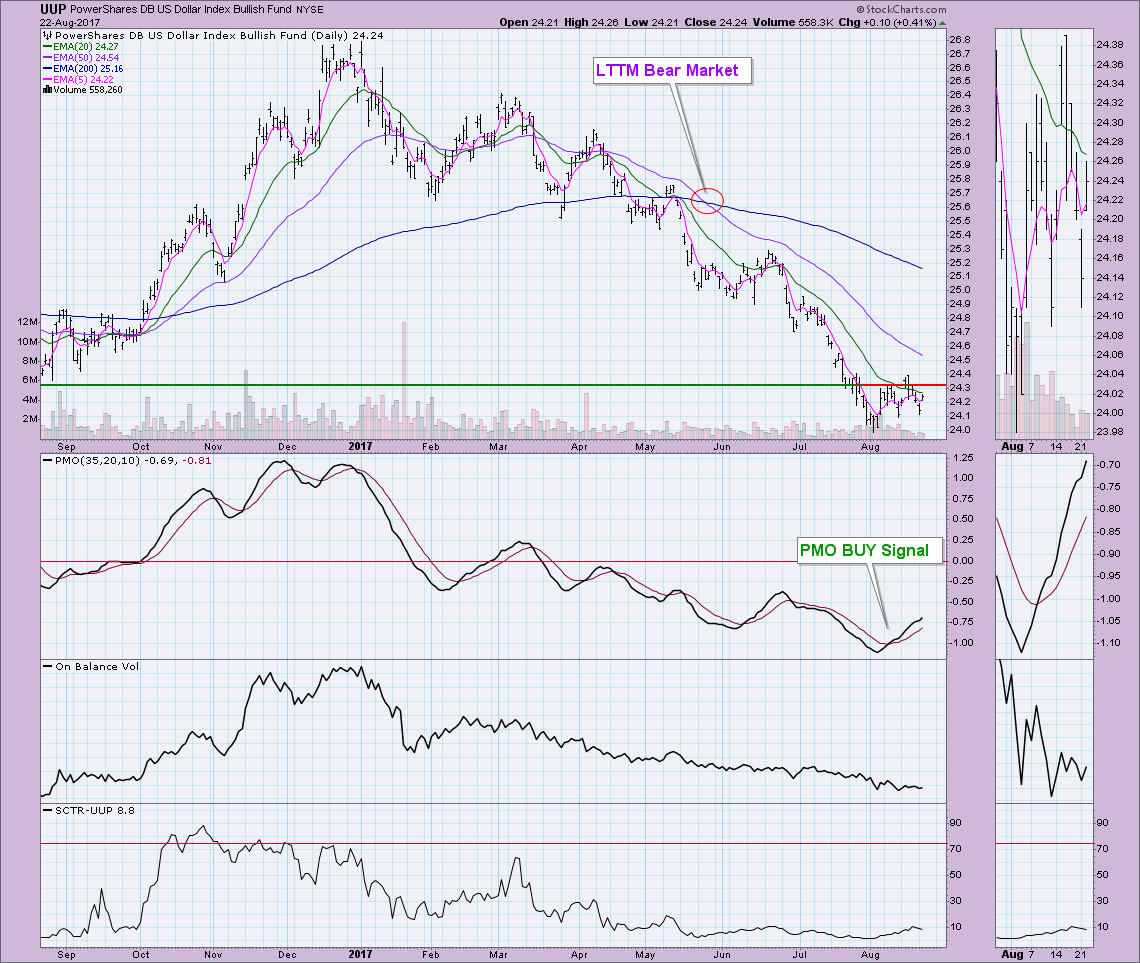
IT Trend Model: NEUTRAL as of 3/21/2016
LT Trend Model: SELL as of 05/24/2017
Since planning my honeymoon in Italy last March, the Dollar broke down below important support at $25.60 for UUP. Since then it has been a death spiral which made those Euro withdrawals in Italy particularly painful. Given that I'm back, It seems likely UUP will begin its recovery. Technically speaking the PMO BUY signal that arrived earlier this month looks good; however, price has been unable to pass through resistance at around $24.30 and the 20-EMA. The OBV isn't revealing anything, but a breakout seems likely here.
Click on "In reply to", for Authors past commentaries
Information posted to this board is not meant to suggest any specific action, but to point out the technical signs that can help our readers make their own specific decisions. Your Due Dilegence is a must! • DiscoverGold
Register for free to join our community of investors and share your ideas. You will also get access to streaming quotes, interactive charts, trades, portfolio, live options flow and more tools.


 News
News  Market Data
  Discover