Evaluating The Technical Damage Inflicted On The S&P 500 By Tom Bowley | August 14, 2017
Market Recap for Friday, August 11, 2017
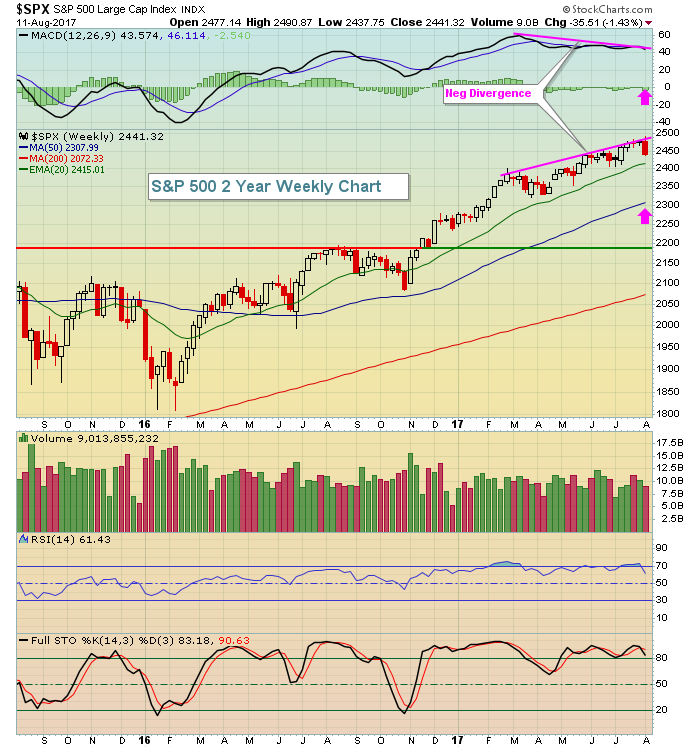
Here's a fact: The benchmark S&P 500, along with all the major U.S. indices, had a rough week last week. Traders aren't used to weekly declines of more than 1%, yet that's exactly what we got last week. The S&P 500 lost 1.43%, its second worst week since the November 2016 uptrend began. Based on that alone, it's difficult to grow overly bearish as buyers have seemed to step up the past ten months no matter what the crisis. This time could be different, however, as we're faced with seasonal headwinds in August and September and weekly momentum (MACD) has been flashing warning signs since the May breakout to fresh all-time highs.
The following chart highlights the negative divergence that we need to be aware of:
The pink arrows mark the MACD centerline and the 50 week SMA, two levels that I look to be tested following a weekly negative divergence. It doesn't always happen so it's not a guarantee. But I view the market as much riskier when a negative divergence is present simply based on experience. I believe the S&P 500 will grow much more precarious if it closes beneath its rising 20 week EMA
Technology (XLK, 0.69%) led the bounce on Friday in terms of sector leadership, but the only sector to end the week with gains was consumer staples (XLP, +0.18%) and the XLP represents a defensive group of stocks. To the downside, financials (XLF, -2.60%) and energy (XLE, -2.59%) were hit the hardest last week. In order to feel good about the market action in the near-term, we need to see another breakout to all-time highs on heavier than normal volume and with leadership from our aggressive sectors - technology, consumer discretionary, industrials and financials.
Pre-Market Action
Gold ($GOLD) and crude oil ($WTIC) are set to open the week with minor losses as global equity markets rally after stumbling last week. In Asia, we saw mostly higher prices and the key European markets are all higher this morning. The German DAX ($DAX) is particularly strong, rising 1.16% at last check. That should help to provide a lift to U.S. equities and, so far, it has. Dow Jones futures are up 100 points with a little more than 30 minutes to go before we're off and running with a new trading week.
Current Outlook
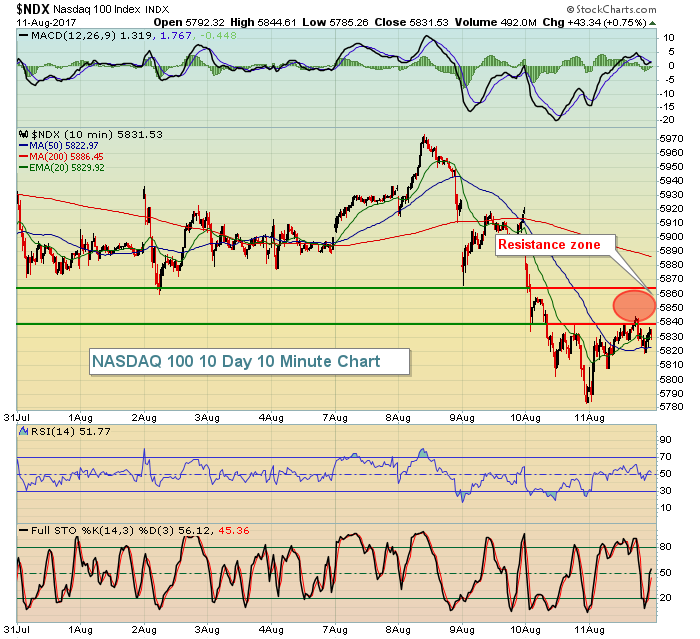
Given the strength in U.S. futures this morning, I'd keep a close eye on the 5865-5870 area on the NASDAQ 100 ($NDX). This has been a leading index in the U.S., but recently has run into technical struggles. So this is the index I'll be watching closest. First, realize that the declining 20 day EMA is at 5869. After breaking below this key moving average, it becomes a very important test of resistance. On the intraday, 10 minute chart, this is what the NDX looks like:
Let's see if we can clear this resistance zone first. If so, we have a shot for further short-term gains. If not, expect the selling to intensify once again this week. . .
Information posted to this board is not meant to suggest any specific action, but to point out the technical signs that can help our readers make their own specific decisions. Your Due Dilegence is a must! • DiscoverGold
Register for free to join our community of investors and share your ideas. You will also get access to streaming quotes, interactive charts, trades, portfolio, live options flow and more tools.


 News
News  Market Data
  Discover