


| Followers | 681 |
| Posts | 141561 |
| Boards Moderated | 35 |
| Alias Born | 03/10/2004 |
Sunday, August 13, 2017 9:42:30 AM
#Real Investment Report
By Lance Roberts | August 12, 2017
Lengthy article but worth reading it...
• Market Drop Triggers Sell Signal
• Sector & Market Review
• Sector & Market Analysis
• 401k Plan Manager
Short-Term Sell Signal Triggered
As I was out on vacation recently, I want to start this week’s missive by picking up where I left off previously:
“As shown in the bottom part of the chart above, on a very short-term basis the market currently remains on a ‘buy signal,’ however, the weakness of the market over the last couple of days has led to some deterioration. Furthermore, the market is struggling with recent resistance levels as the overbought condition continues to limit the advance.
We remain cautious, however, on the type of ‘risks’ we take on in portfolios. Capital preservation always remains our priority over chasing returns.”
I have updated the chart below from two week’s ago. The weakness in the market previously, combined with the threats between the U.S. and North Korea, led to a fairly sharp unwinding in equities on Thursday which in turn triggered a short-term sell signal.
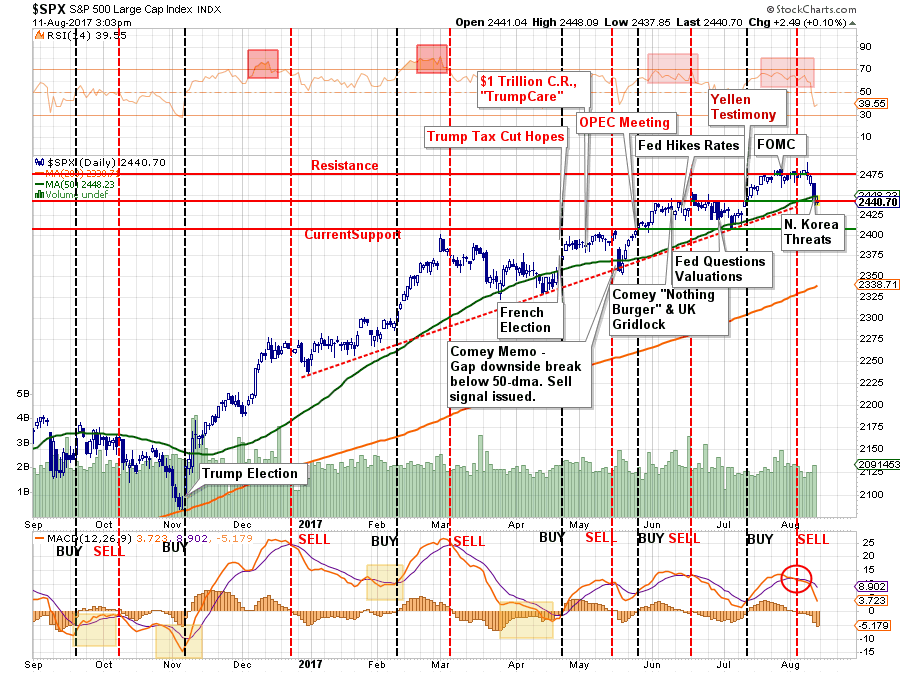
That sell-off has remained confined to the current bullish trendline but has threatened to violate the 50-dma. If the market is unable to regain the 50-dma on Monday, and remain above it for the balance of the coming week, the most likely move in the markets will be lower.
This was a “risk” I addressed this past Tuesday:
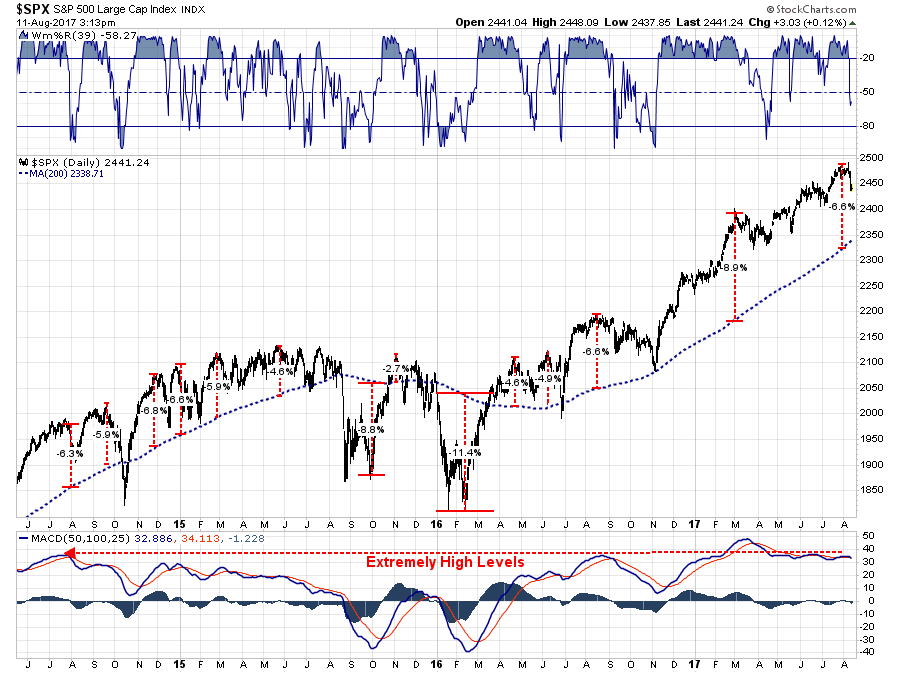
“This divergence will likely not last much longer, the only question is whether the internals will ‘catch up,’ as the ‘bulls’ currently hope?
Deviations from both intermediate and long-term moving averages have also reached levels that become problematic for further advances without a correction first. The first chart is the percentage deviation from the 200-day moving average. At almost 7%, it is one of the larger deviations over the last 3-years and, as shown, has always resulted in at least a short-term correction.”
Chart updated through Friday:
So…Should I “Buy The F*$(@!# NOKO?”
My best guess currently is – probably. But not yet.
The reason I say that is for two reasons:
1. Bull markets don’t typically end when the mainstream media is “peeing down both legs” over the 1.5% drop on Thursday.
2. The bullish uptrend remains intact and “fear” gauges remain confined to a downtrend.
The chart below goes back to the beginning of the bull market advance following the 2012 correction. Notice that while the market remained in the QE backed bullish advance, volatility remained confined to a downtrend with the brief exception the “taper tantrum” in October 2014.
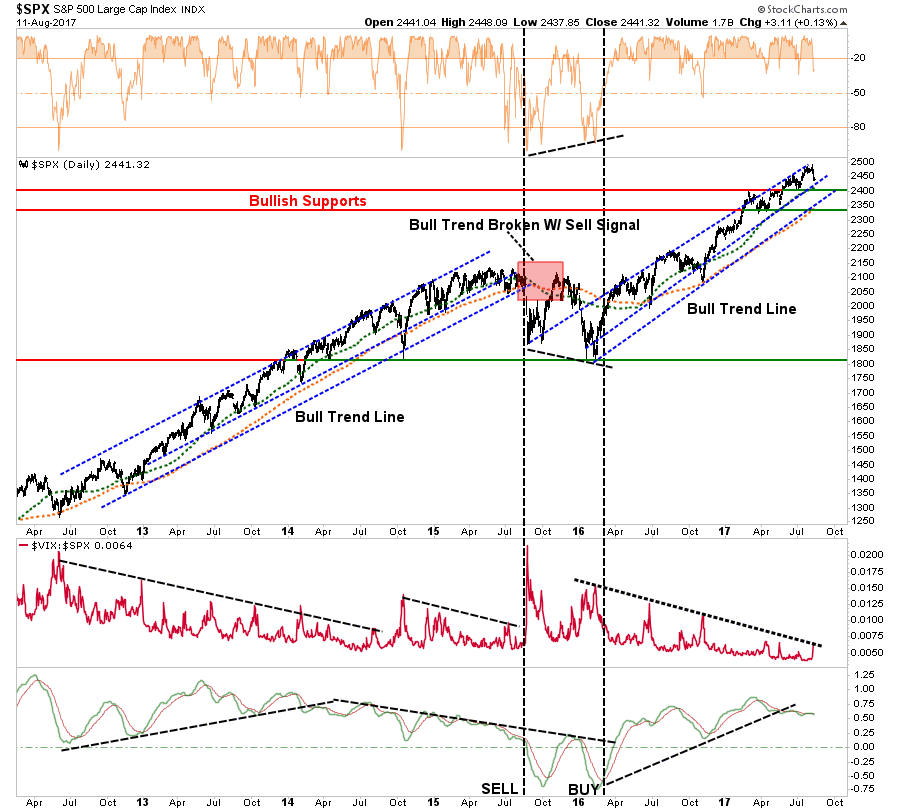
However, notice the bottom part of the chart. As the bull trend remained intact, the general trend of prices was rising. However, beginning in 2014, that trend became negative as the “momentum” of the advance began to stall. Eventually, that deterioration in price momentum led to a bigger correction and a break of the “bullish trend” in late 2015 and early 2016.
Currently, we are seeing the same “deterioration” in price momentum. However, the market remains confined within its overall bullish trend while volatility remains confined to downtrend. Given this backdrop, I would suspect that current weakness will result in an internal rotation of sector participation as “bulls” continue to ignore the mounting risk of deteriorating of reported EPS growth, weak revenue growth, slowing economic growth and fading realities of positive legislative agenda coming to fruition.
In our portfolios, we will wait for confirmation the current sell-off has abated before adding additional risk exposure to portfolios. In recent years, such market tantrums have been very short-lived and have provided opportunistic entry points for increasing equity related exposure. However, EVERY TIME is DIFFERENT, so it is always important to NEVER ASSUME the outcome will be the same as the last. That is how you wind up losing a lot of money.
As shown in the chart above, with the market on a very short-term sell signal, and still very overbought, it will likely prove prudent to remain patient and see if the markets can regain more solid footing next week.
I will update this analysis on Tuesday for any potential changes.
So, IF we get an opportunity to put “dry powder” to work in the SHORT TERM, where might we find some opportunities. That is where we will spend the rest of today’s missive.
Sector & Market Review & Analysis. . .
* * *
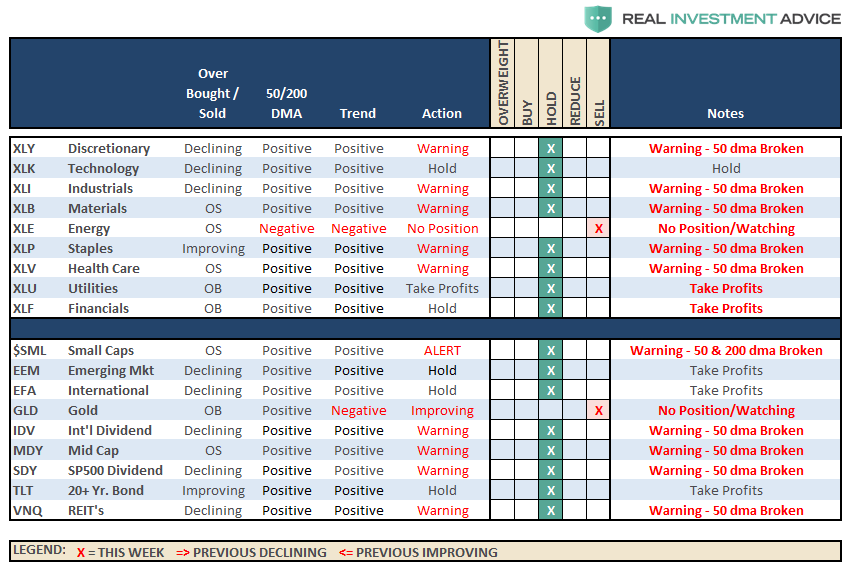
Sector Recommendations:
The table below shows thoughts on specific actions related to the current market environment.
(These are not recommendations or solicitations to take any action. This is for informational purposes only related to market extremes and contrarian positioning within portfolios. Use at your own risk and peril.)
* * *
https://realinvestmentadvice.com/btf-noko-08-11-17/
• DiscoverGold
Click on "In reply to", for Authors past commentaries
By Lance Roberts | August 12, 2017
Lengthy article but worth reading it...
• Market Drop Triggers Sell Signal
• Sector & Market Review
• Sector & Market Analysis
• 401k Plan Manager
Short-Term Sell Signal Triggered
As I was out on vacation recently, I want to start this week’s missive by picking up where I left off previously:
“As shown in the bottom part of the chart above, on a very short-term basis the market currently remains on a ‘buy signal,’ however, the weakness of the market over the last couple of days has led to some deterioration. Furthermore, the market is struggling with recent resistance levels as the overbought condition continues to limit the advance.
We remain cautious, however, on the type of ‘risks’ we take on in portfolios. Capital preservation always remains our priority over chasing returns.”
I have updated the chart below from two week’s ago. The weakness in the market previously, combined with the threats between the U.S. and North Korea, led to a fairly sharp unwinding in equities on Thursday which in turn triggered a short-term sell signal.

That sell-off has remained confined to the current bullish trendline but has threatened to violate the 50-dma. If the market is unable to regain the 50-dma on Monday, and remain above it for the balance of the coming week, the most likely move in the markets will be lower.
This was a “risk” I addressed this past Tuesday:
“This divergence will likely not last much longer, the only question is whether the internals will ‘catch up,’ as the ‘bulls’ currently hope?
Deviations from both intermediate and long-term moving averages have also reached levels that become problematic for further advances without a correction first. The first chart is the percentage deviation from the 200-day moving average. At almost 7%, it is one of the larger deviations over the last 3-years and, as shown, has always resulted in at least a short-term correction.”
Chart updated through Friday:

So…Should I “Buy The F*$(@!# NOKO?”
My best guess currently is – probably. But not yet.
The reason I say that is for two reasons:
1. Bull markets don’t typically end when the mainstream media is “peeing down both legs” over the 1.5% drop on Thursday.
2. The bullish uptrend remains intact and “fear” gauges remain confined to a downtrend.
The chart below goes back to the beginning of the bull market advance following the 2012 correction. Notice that while the market remained in the QE backed bullish advance, volatility remained confined to a downtrend with the brief exception the “taper tantrum” in October 2014.

However, notice the bottom part of the chart. As the bull trend remained intact, the general trend of prices was rising. However, beginning in 2014, that trend became negative as the “momentum” of the advance began to stall. Eventually, that deterioration in price momentum led to a bigger correction and a break of the “bullish trend” in late 2015 and early 2016.
Currently, we are seeing the same “deterioration” in price momentum. However, the market remains confined within its overall bullish trend while volatility remains confined to downtrend. Given this backdrop, I would suspect that current weakness will result in an internal rotation of sector participation as “bulls” continue to ignore the mounting risk of deteriorating of reported EPS growth, weak revenue growth, slowing economic growth and fading realities of positive legislative agenda coming to fruition.
In our portfolios, we will wait for confirmation the current sell-off has abated before adding additional risk exposure to portfolios. In recent years, such market tantrums have been very short-lived and have provided opportunistic entry points for increasing equity related exposure. However, EVERY TIME is DIFFERENT, so it is always important to NEVER ASSUME the outcome will be the same as the last. That is how you wind up losing a lot of money.
As shown in the chart above, with the market on a very short-term sell signal, and still very overbought, it will likely prove prudent to remain patient and see if the markets can regain more solid footing next week.
I will update this analysis on Tuesday for any potential changes.
So, IF we get an opportunity to put “dry powder” to work in the SHORT TERM, where might we find some opportunities. That is where we will spend the rest of today’s missive.
Sector & Market Review & Analysis. . .
* * *
Sector Recommendations:
The table below shows thoughts on specific actions related to the current market environment.
(These are not recommendations or solicitations to take any action. This is for informational purposes only related to market extremes and contrarian positioning within portfolios. Use at your own risk and peril.)

* * *
https://realinvestmentadvice.com/btf-noko-08-11-17/
• DiscoverGold
Click on "In reply to", for Authors past commentaries
Information posted to this board is not meant to suggest any specific action, but to point out the technical signs that can help our readers make their own specific decisions. Your Due Dilegence is a must!
• DiscoverGold
Join the InvestorsHub Community
Register for free to join our community of investors and share your ideas. You will also get access to streaming quotes, interactive charts, trades, portfolio, live options flow and more tools.

