


| Followers | 689 |
| Posts | 143817 |
| Boards Moderated | 35 |
| Alias Born | 03/10/2004 |
Wednesday, June 28, 2017 9:18:39 AM
DP Alert: NDX Posts New ST Trend Model Neutral Signal - TLT Fake Out Breakout
By Erin Heim | June 27, 2017
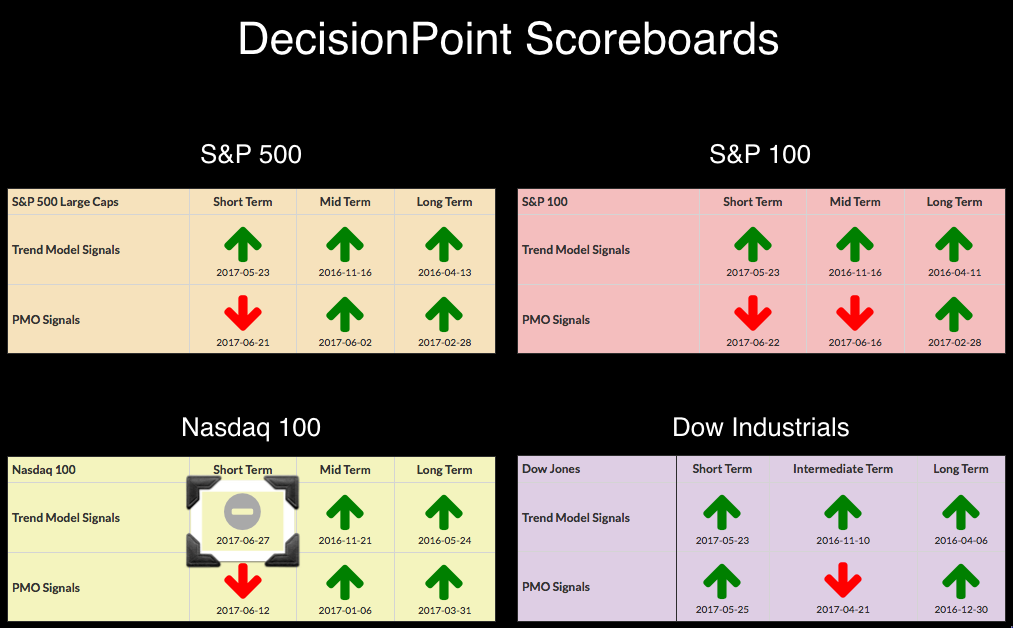
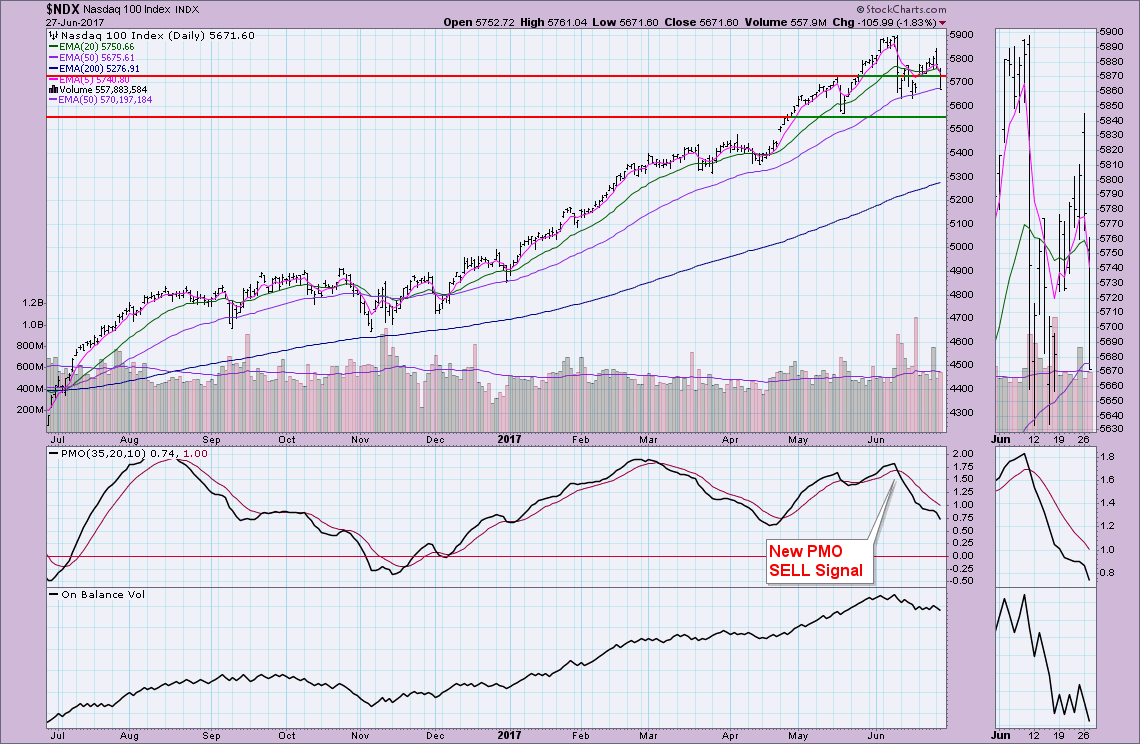
As annotated on the DecisionPoint Scoreboard Summary, the Nasdaq 100 just triggered a new Short-Term Trend Model (STTM) Neutral signal as the 5-EMA crossed below the 20-EMA on the daily chart. Today's breakdown took out support at the May high and closed just below the 50-EMA. The PMO on the NDX is reaching previously oversold territory which is encouraging, but it is pointed straight down right now. I suspect we will see previous June lows tested at a minimum.
SIGNALS: Here we include charts of any important signal changes triggered today by our Intermediate-Term Trend Model.
NO NEW SIGNALS TO REPORT.
STOCKS
IT Trend Model: BUY as of 11/15/2016
LT Trend Model: BUY as of 4/1/2016
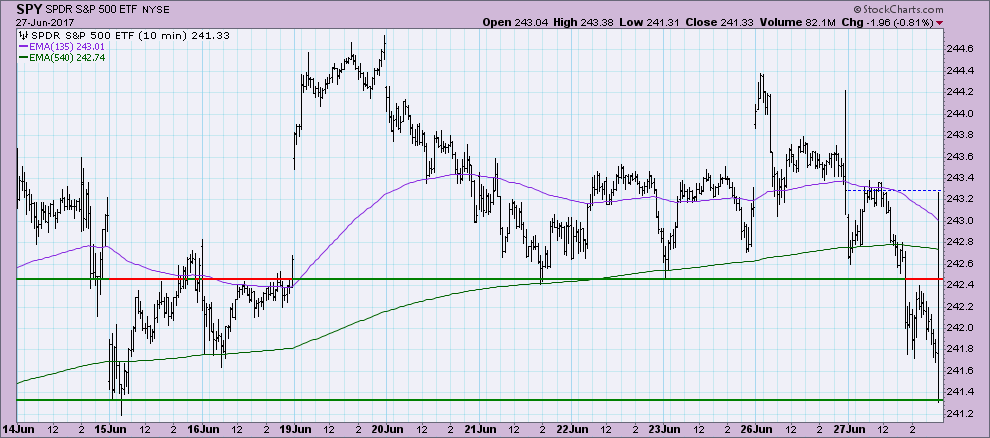
It wasn't a good day for the market as it traded below yesterday's close nearly all day. Not sure what the final 10 minute trading bar is related to, but most important is the close finished at session lows.
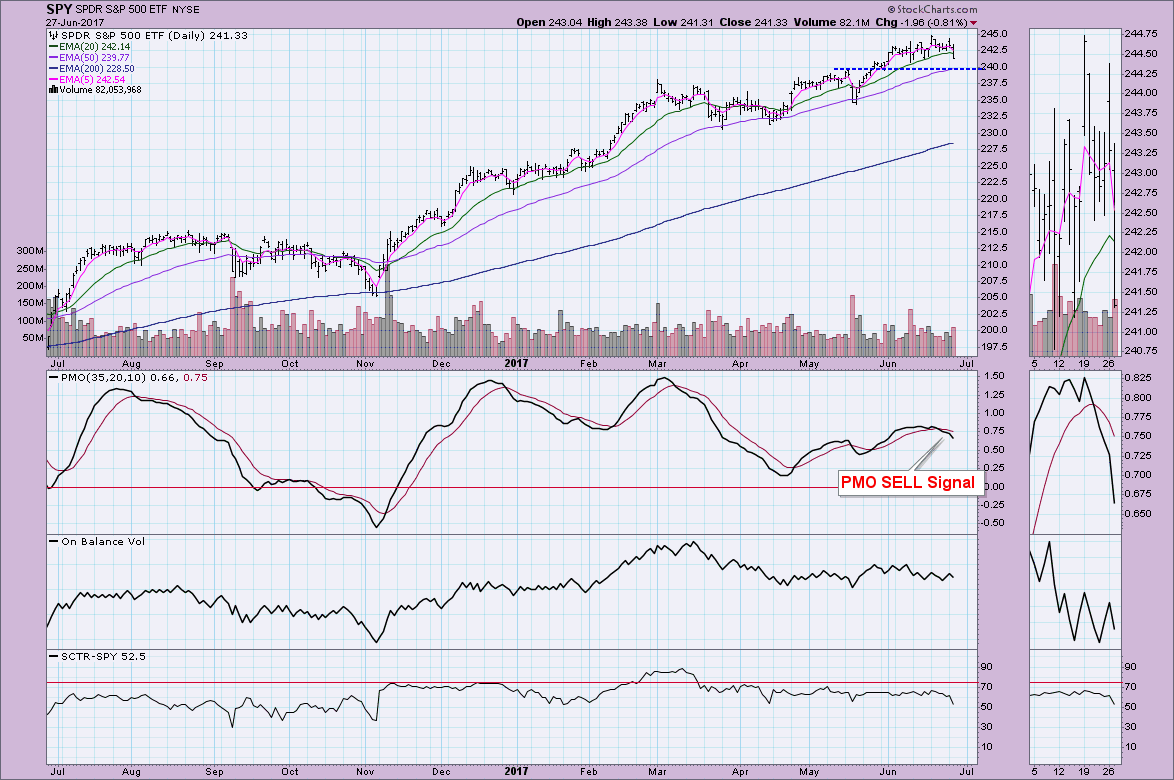
I find it disconcerting that after the last PMO BUY signal the market failed to rally much higher and has really been consolidating sideways throughout June. The new SELL signal could bring damage rather than consolidation this time. We're starting to see a gradual decline in the OBV and now the SCTR. Originally I thought that the support at the May high would hold just fine. I'm a little less optimistic seeing the SCTR dropping off and the failure of the 20-EMA holding as support.
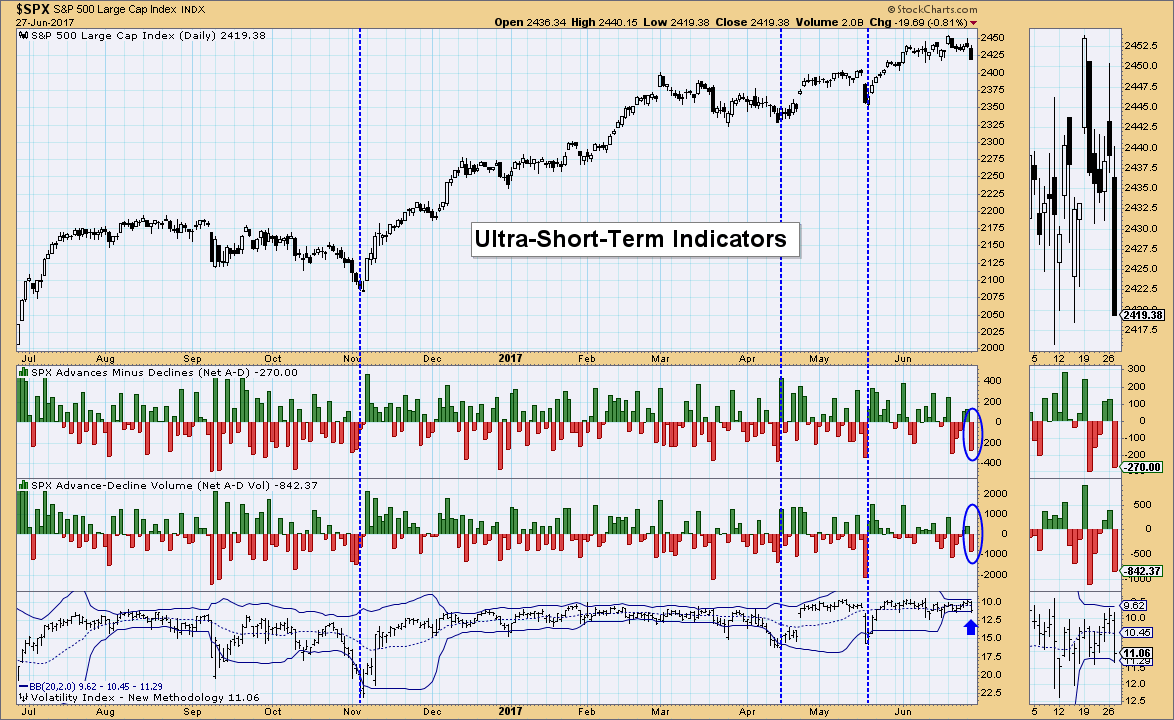
Ultra-Short-Term Indicators: We saw some climactic downside readings in breadth today that coincided with a penetration of the lower Bollinger Band. Since the market has essentially be tailing off for the past week, I consider these climactic readings in the very short term as bullish. The previous cases that I've highlighted finished with more than a rally pop and morphed into a rising trend. I do NOT think that will be the case based on my analysis above and the indicators below. We could see a reactionary bounce, but not a lengthy one.
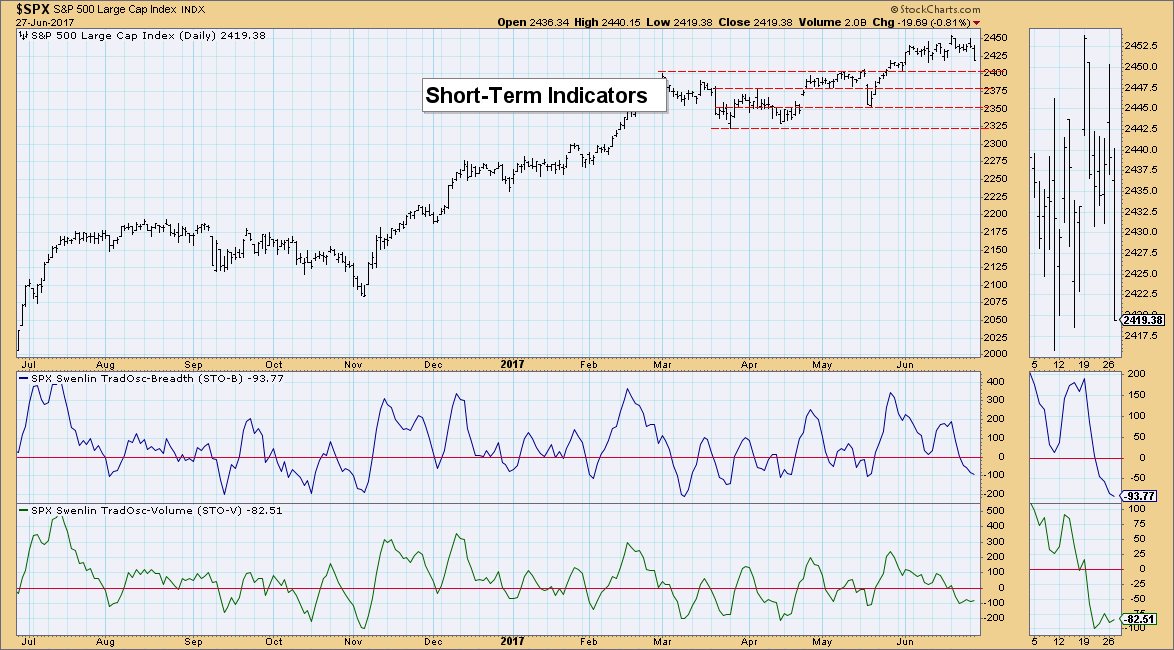
Short-Term Indicators: These indicators are beginning to decelerate in near-term oversold territory. The STO-B has yet to bottom and I find that bearish.
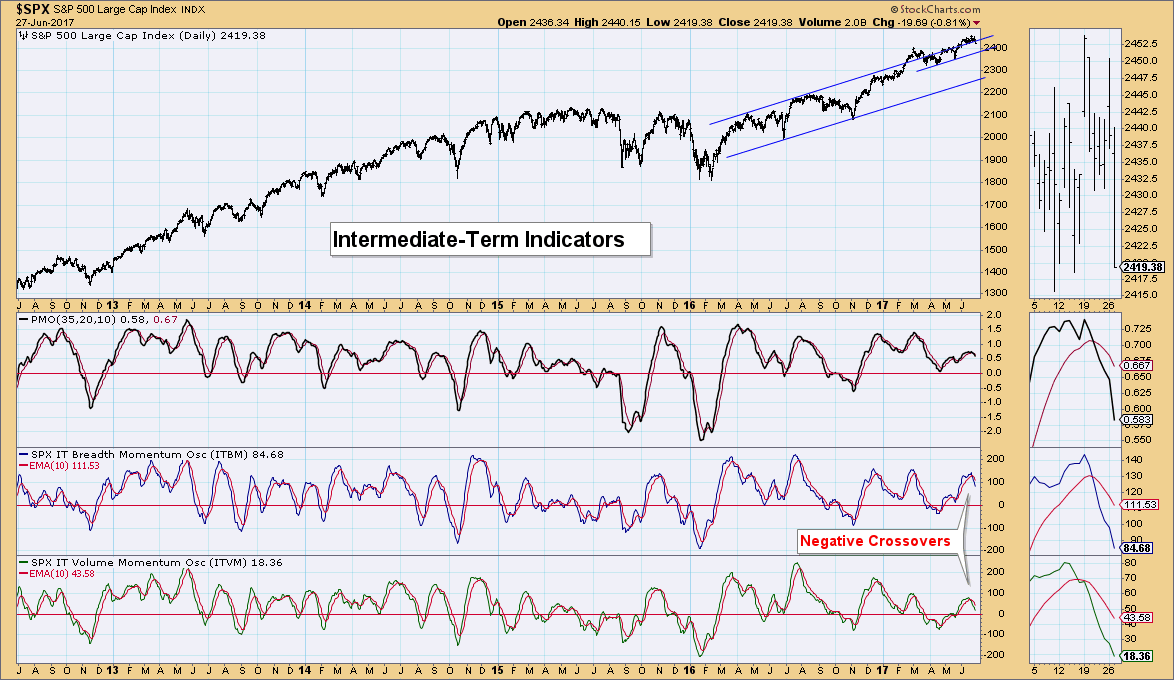
Intermediate-Term Indicators: These indicators have me worried. We are seeing a top and negative crossovers arriving right around the same time as the top of the rising trend channel is being punctured to the downside. I've drawn in a short-term rising bottoms trend line that could provide some support, but the cavern below that trendline is quite concerning.
Conclusion: It occurred to me while looking at the charts that our previous PMO BUY signal didn't amount to much. Typically in the bull market that we've been experiencing since the election, PMO BUY signals result in nice gains and PMO SELL signals are met with sideways consolidation, not corrections. This is different and therefore, concerning. I think we will likely see a small bounce tomorrow and maybe the next day, but intermediate-term indicators suggest we'll be lucky if we can get just consolidation out of this bearish scenario. . .
http://stockcharts.com/articles/decisionpoint/2017/06/dp-alert-ndx-posts-new-st-trend-model-neutral-signal---tlt-fake-out-breakout.html
• DiscoverGold
Click on "In reply to", for Authors past commentaries
By Erin Heim | June 27, 2017
As annotated on the DecisionPoint Scoreboard Summary, the Nasdaq 100 just triggered a new Short-Term Trend Model (STTM) Neutral signal as the 5-EMA crossed below the 20-EMA on the daily chart. Today's breakdown took out support at the May high and closed just below the 50-EMA. The PMO on the NDX is reaching previously oversold territory which is encouraging, but it is pointed straight down right now. I suspect we will see previous June lows tested at a minimum.


SIGNALS: Here we include charts of any important signal changes triggered today by our Intermediate-Term Trend Model.
NO NEW SIGNALS TO REPORT.
STOCKS
IT Trend Model: BUY as of 11/15/2016
LT Trend Model: BUY as of 4/1/2016
It wasn't a good day for the market as it traded below yesterday's close nearly all day. Not sure what the final 10 minute trading bar is related to, but most important is the close finished at session lows.

I find it disconcerting that after the last PMO BUY signal the market failed to rally much higher and has really been consolidating sideways throughout June. The new SELL signal could bring damage rather than consolidation this time. We're starting to see a gradual decline in the OBV and now the SCTR. Originally I thought that the support at the May high would hold just fine. I'm a little less optimistic seeing the SCTR dropping off and the failure of the 20-EMA holding as support.

Ultra-Short-Term Indicators: We saw some climactic downside readings in breadth today that coincided with a penetration of the lower Bollinger Band. Since the market has essentially be tailing off for the past week, I consider these climactic readings in the very short term as bullish. The previous cases that I've highlighted finished with more than a rally pop and morphed into a rising trend. I do NOT think that will be the case based on my analysis above and the indicators below. We could see a reactionary bounce, but not a lengthy one.

Short-Term Indicators: These indicators are beginning to decelerate in near-term oversold territory. The STO-B has yet to bottom and I find that bearish.

Intermediate-Term Indicators: These indicators have me worried. We are seeing a top and negative crossovers arriving right around the same time as the top of the rising trend channel is being punctured to the downside. I've drawn in a short-term rising bottoms trend line that could provide some support, but the cavern below that trendline is quite concerning.

Conclusion: It occurred to me while looking at the charts that our previous PMO BUY signal didn't amount to much. Typically in the bull market that we've been experiencing since the election, PMO BUY signals result in nice gains and PMO SELL signals are met with sideways consolidation, not corrections. This is different and therefore, concerning. I think we will likely see a small bounce tomorrow and maybe the next day, but intermediate-term indicators suggest we'll be lucky if we can get just consolidation out of this bearish scenario. . .
http://stockcharts.com/articles/decisionpoint/2017/06/dp-alert-ndx-posts-new-st-trend-model-neutral-signal---tlt-fake-out-breakout.html
• DiscoverGold
Click on "In reply to", for Authors past commentaries
Information posted to this board is not meant to suggest any specific action, but to point out the technical signs that can help our readers make their own specific decisions. Your Due Dilegence is a must!
• DiscoverGold
Join the InvestorsHub Community
Register for free to join our community of investors and share your ideas. You will also get access to streaming quotes, interactive charts, trades, portfolio, live options flow and more tools.

