


Sunday, June 25, 2017 9:23:50 PM
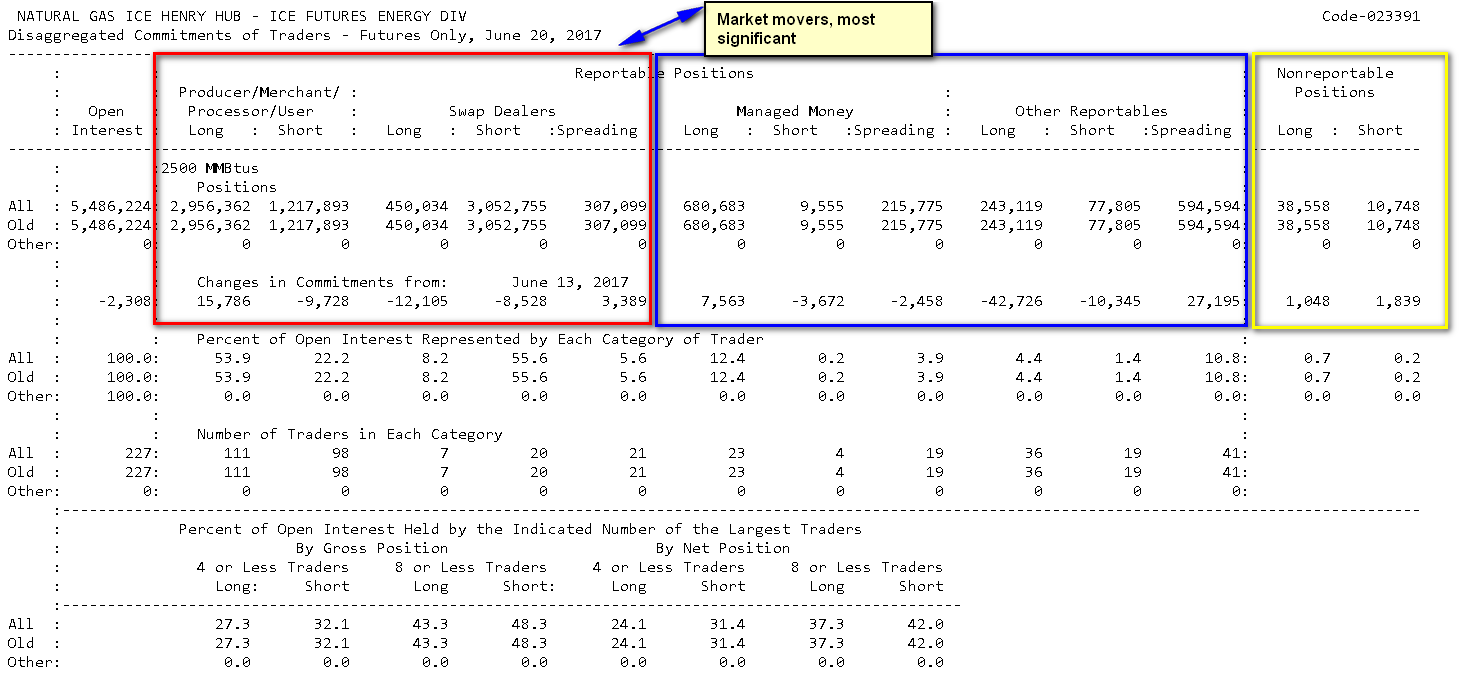
Commercial Hedgers (Red Box) – institutions and individuals who manage the cash side of the business in the underlying commodity, like farmers, miners, international businesses and processors. Commercials are free from position limits.
Non-Commercials (Large Speculators Blue Box) – This is typically a large floor trader, a managed futures account, or a small hedge fund. In general, these types of traders are technically trend followers. Since the large speculators are consistent trend followers and usually overdo it at extremes, we want to follow their movements with caution as they are usually wrong.
Small Speculators (Yellow Box) – This includes all speculators with positions below reportable limits and small hedgers.
The data is about a week late when we receive it and this is a serious drawback in using it. Many traders have placed much importance on the numbers. Depending on which school of thought you belong to, some traders will follow the large traders, others will follow the commercials and a minority the small speculators. I will explain through a series of examples later why I follow the commercials.
When prices go up, speculators want to buy more contracts and producers want to sell more of what they are trading. This is an important law of the world we live in.
When prices go down, speculators want to sell more contracts and processors want to buy more of what they are trading. Analyse the mind-set of the speculator who is trying to make money from the current downtrend; his bet is it will continue, so he sells short in the hope that prices will go down more and profits will increase.
The commercials on the other hand are not trying (almost always) to make money from what the market is doing, but rather from the current of the market or commodity. If the commercials see a price that is lower than they have been paying, they will often buy because the cost of the product they make with the commodity is lower. Therefore the mark up is better than it was when the cost of production was higher and the commodity cost more.
Notes:
When the net position of the large speculators is at an extreme, expect the market to move in the opposite direction of the net position of the large speculators. For example, if the large speculators are net long and the net position is at an extreme and prices have been moving up, expect the price of the commodity to correct down.
The large traders can and do make money when they catch a trend move, but such strong trends are rare. There is a greater chance the commercials will be correct.
It is worth noting that at the best sell points, the large traders had on their largest, most bullish positions. Further, at the extreme lows the large traders had on their largest short positions. They were obviously looking for lower prices right at the low.
Important:
COT Commercials – This is my favourite application of the COT. It is useful in spotting intermediate to longer term trade set-ups. Why? If you understand what the COT commercials number means, you will be able to find trade set-ups with large moves. This should be used with other tools to time our entry and I will explain this later.
I only use the COT commercials in certain markets. They work best in markets that “walk on the ground (for example live cattle) or come out of the ground (for example crude oil)”.
The commercials tend to move in the opposite direction of the market. When prices are increasing, the commercials will usually be declining and conversely. They do not use the markets for speculation but to buy and sell products they need accordingly.
The examples I have featured in this article show that each time the commercial's buying exceeded their selling and the net position was above the zero line, a market rally was imminent. The question we need to answer is how can a market rally when so many commercials are selling following their net long positions ? Remember they are selling products they own. Unlike speculators, they are not trying to make money from the market by selling short; in fact they are selling what they own to the market place. Commercials after all are hedgers and are usually selling. It is unusual for them to be long over time.
If the commercials are net long, you can expect the market to turn higher at some point in the future. However, it is critical as part of your trading plan to use a timing trigger to go long because the commercials can stay in losing positions for a long-time as they average down their cost. Unless you have deep pockets, this is a risky strategy.
Timing Trigger
We have seen through various examples how the COT commercials can alert us to a major bull market well ahead of time. However, if we buy just because the commercials are buying or if we sell just because they are selling, we are playing with fire. We need to use a trigger to position our trades based on analysis of the COT commercials data. Commercials are often on the long side of the market before a major rally begins and they often move to a negative (hedged) position once the rally begins. Moving to a negative position does not suggest the bull move is over. In fact, it often confirms the continuation of a bull rally. The fact the commercials are adding to their hedge position on a scale up as prices rise does not change the course of the bull market.
One of the triggers that I use with the COT commercials is the Williams Accumulation / Distribution (AD) and its 28 period moving average MA.
Example using Crude oil:

Figure 9 shows Crude Oil weekly futures chart from April 2003 to July 2006. I have marked the positions where the COT commercials were net long (above zero line). Once this occurred it was only a matter of time before futures prices started to increase. I have also included the Williams AD/MA to provide a timing trigger
At point “A” COT was above zero line (net long) and AD was below the MA showing possible weakness. At “B” and “C” COT was positive and AD was above MA suggesting a BUY for intermediate term. At “D” COT becomes negative, but AD/MA remains positive suggesting the bull market should continue. At “E” COT becomes positive and AD was above the MA pointing to a possible long entry into the market. At “F” COT becomes net short but once again AD was above MA signalling that futures prices should continue to rise. At “G” the commercials were net long and AD was above the MA highlighting another possible entry point. At “H” COT was negative but AD was again above MA marking the bull run should continue. At “I” COT commercials was net long but the AD was below the MA suggesting possible weakness. At “J” the COT turned positive and the AD was above the MA inferring futures prices may increase (as was the case).
General Rules :
To achieve success, I include these rules as part of the timing trigger within my trading plan:
*Use a weekly chart of the COT commercials with a Williams Accumulation / Distribution and its 28 period MA (AD/MA).
*If commercials COT are above the zero line (net long) then check the Williams AD/MA. If the AD is above its MA, then there is a potential to go long.
*If commercials COT is positive and AD/MA is not, then wait for AD/MA to turn positive before entering long. However, if the COT turns negative then it must turn positive again before AD/MA can trigger a potential entry.
*If commercials COT is positive and AD/MA is positive, and either of the two turns negative, then there is no change in the expectation the bull trend will likely to continue.
*If commercials COT is positive and AD/MA is positive and both turn negative then the chances are the up trend might not continue. If you are long, use a trailing stop to lock in any profits
*If commercials COT is positive and then turns negative this does not mean the up trend (assuming there is one) is going to end. On the contrary, on many occasions it suggests the opposite.
*In any trade it is important to use risk management techniques. Never risk more than 3% to 5% of your trading capital. A trade may turn sour but the key is to have enough funds to fight another day.
Finally
We have seen the usefulness and drawbacks of the COT reports. The reports are an intermediate to long-term indicator and not the crown of market indicators. However, it does often give us valuable information about a potential change in trend to futures prices, as well as the possibility of a continuation of a trend. It is most useful for spotting potential bullish trends as opposed to bearish trends. As I mentioned in this article, the preference to follow a particular category be it the large speculators, commercials or small speculators is dependent on an individuals reasoning.
FEATURED Cannabix's Breath Logix Alcohol Device Delivers Positive Impact to Private Monitoring Agency in Montana, USA • Apr 25, 2024 8:52 AM
Bantec Reports an Over 50 Percent Increase in Sales and Profits in Q1 2024 from Q1 2023 • BANT • Apr 25, 2024 10:00 AM
Kona Gold Beverages, Inc. Announces Name Change to NuVibe, Inc. and Initiation of Ticker Symbol Application Process • KGKG • Apr 25, 2024 8:30 AM
Axis Technologies Group and Carbonis Forge Ahead with New Digital Carbon Credit Technology • AXTG • Apr 24, 2024 3:00 AM
North Bay Resources Announces Successful Equipment Test at Bishop Gold Mill, Inyo County, California • NBRI • Apr 23, 2024 9:41 AM
Epazz, Inc.: CryObo, Inc. solar Bitcoin operations will issue tokens • EPAZ • Apr 23, 2024 9:20 AM

