:) DP Alert: Rally Pop! Internal Strength Prevails - S&P 600 (IJR) New ITTM BUY Signal By Erin Heim | June 1, 2017
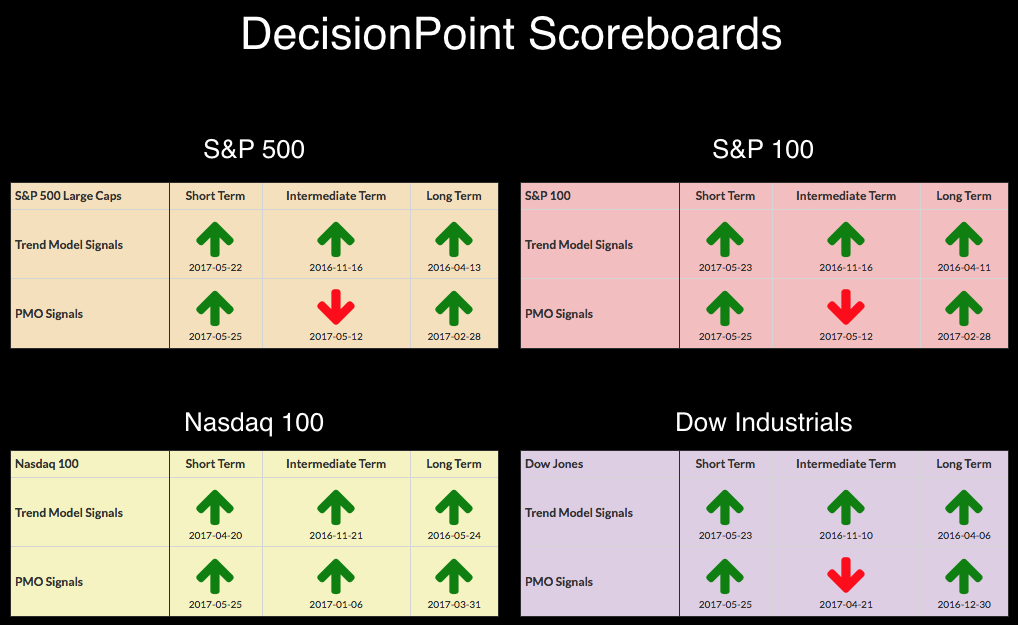
Admittedly I was surprised that the market had just a brilliant day given the very bearish configuration of short-term market indicators. Apparently I should have paid more attention to the short-term buy signals that were produced over the past week or two. The rally brought the S&P 600 ETF (IJR) a new IT Trend Model BUY signal with a PMO nearing a positive crossover BUY signal.
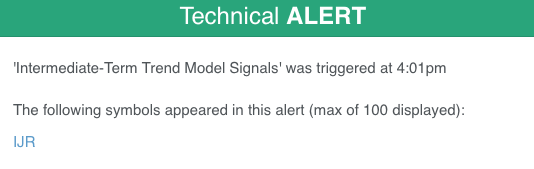
SIGNALS: Here we include charts of any important signal changes triggered today by our Intermediate-Term Trend Model.
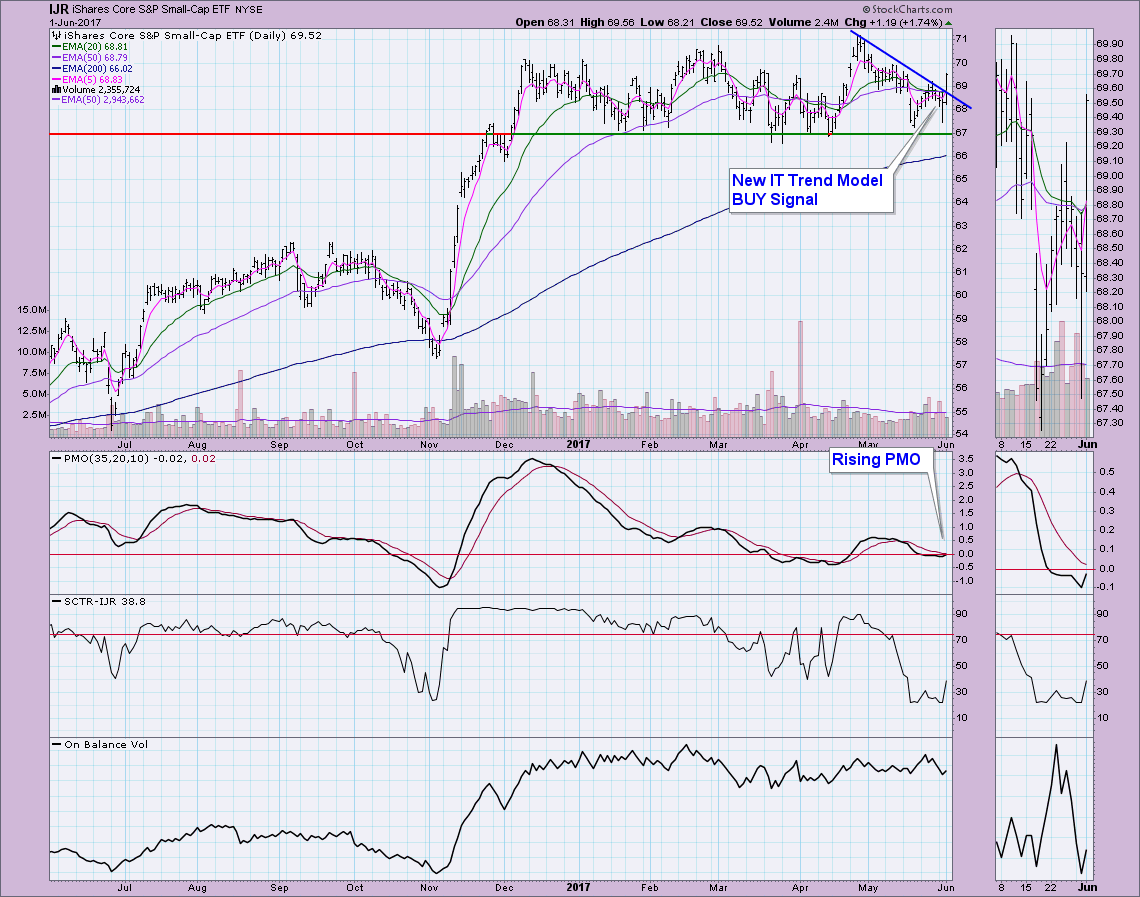
The above alert arrived in my email box after the close courtesy of the StockCharts Technical Alert workbench. I pulled up the chart and saw two very encouraging price bars. The first was yesterday's where we saw horizontal support along this year's lows hold easily. Next is today's impressive price bar breakout. The ST and IT Trend Models triggered BUY signals today. The STTM signal is generated when the 5-EMA crosses above the 20-EMA. The ITTM buy signal is generated when the 20-EMA crosses above the 50-EMA. I think these signals are little suspect because the margins between the EMAs are minuscule which could cause whipsaw signals over the next week. If we see follow-through, the upside target is around $71.
STOCKS
IT Trend Model: BUY as of 11/15/2016
LT Trend Model: BUY as of 4/1/2016
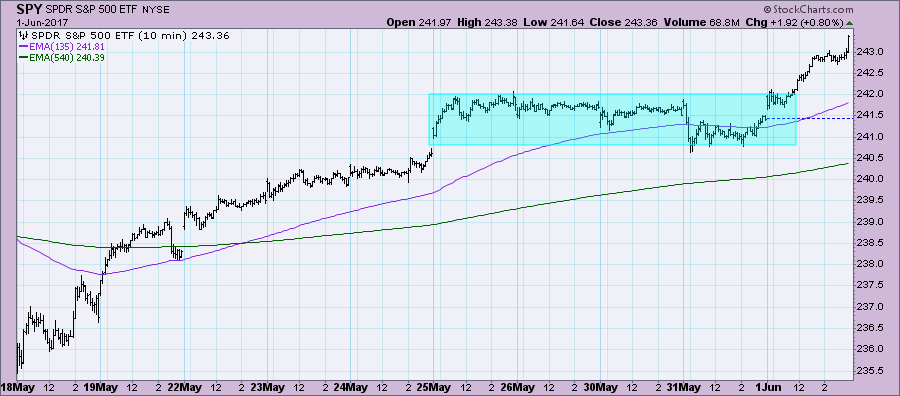
Pulled away from the consolidation zone of the past week quite easily. The last 10-minutes saw an impressive jump to end the day closing near the day's highs.
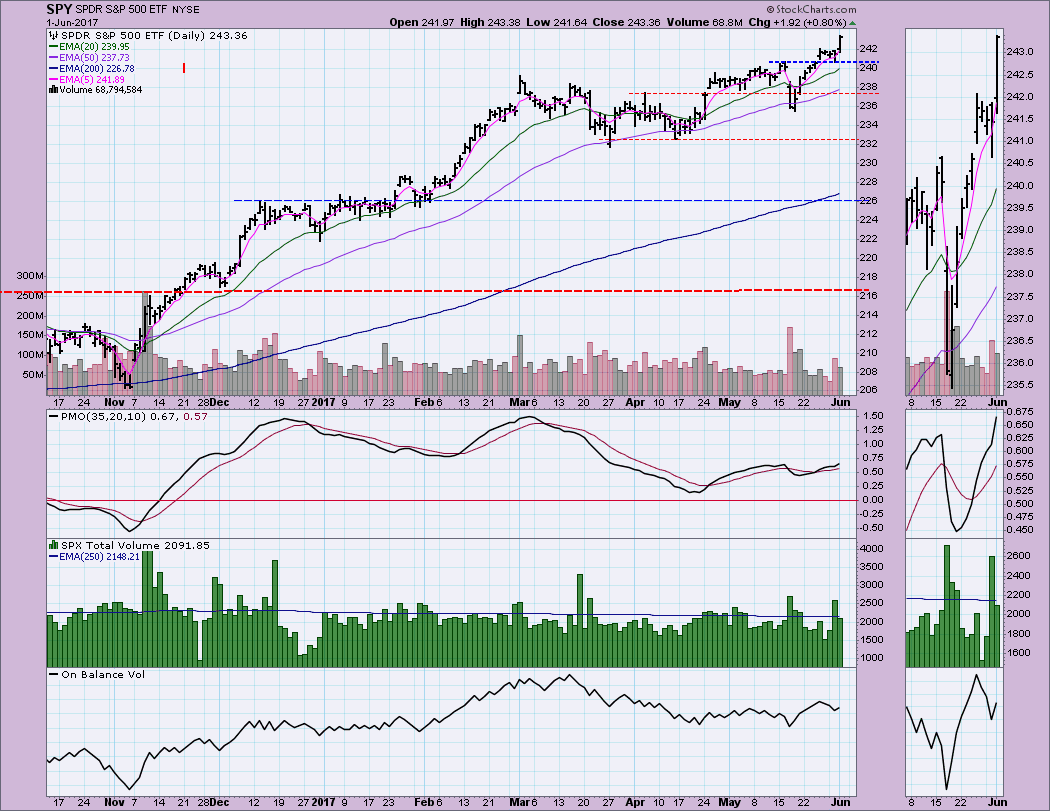
The price bar on the SPY daily chart shows the breakout to new all-time highs. The Trend Models are positively configured with plenty of margin among them so the price trends continue to be very bullish. Seeing the PMO reach above the previous top is a bullish confirmation.
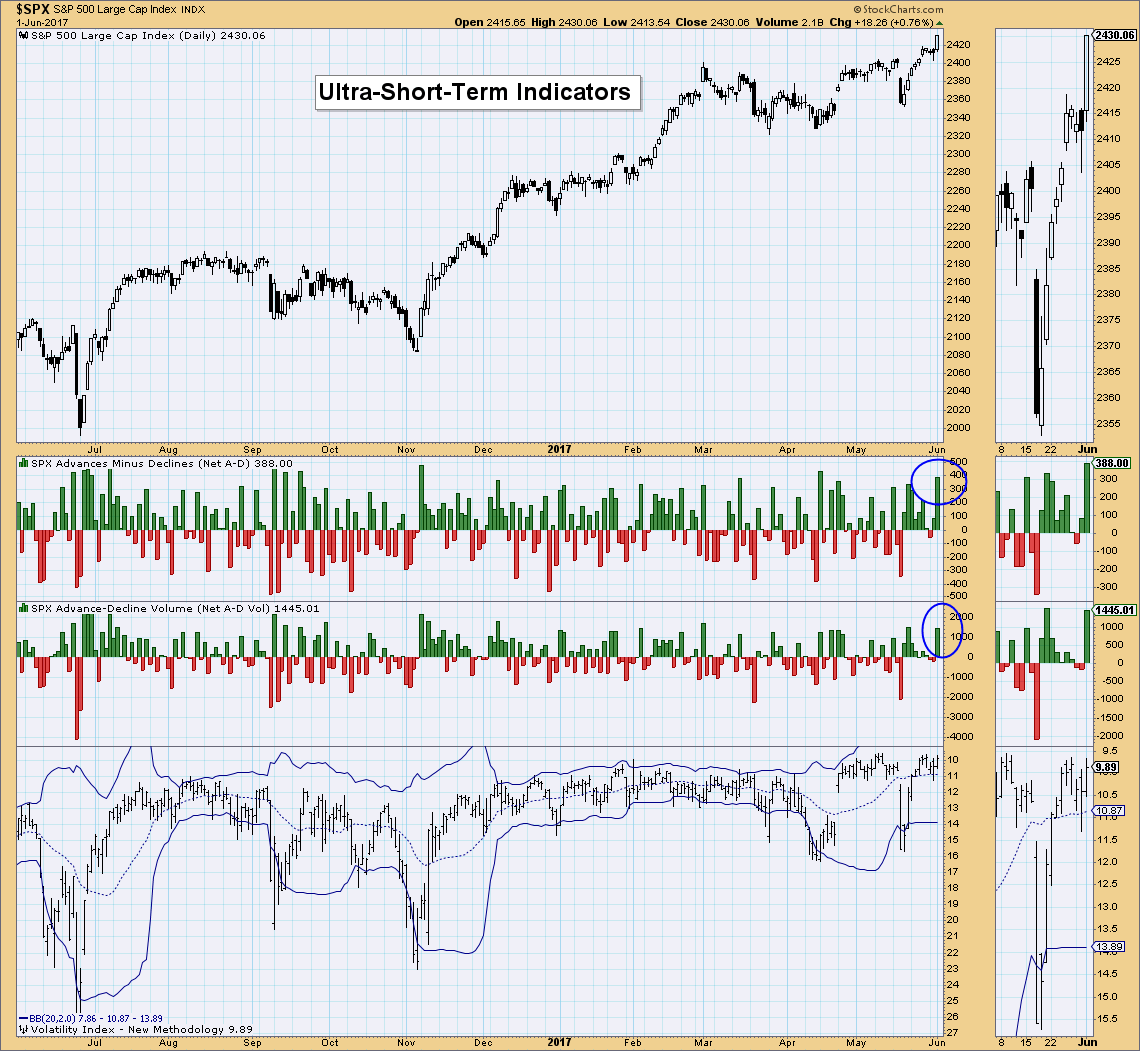
Ultra-Short-Term Indicators: Not surprisingly, breadth was clearly biased to advancers, creating climactic readings on Net A-D price and volume. I don't think we are looking at a buying exhaustion. More likely, an initiation to higher prices. That's one bullish white candlestick, nearly a Marubozu where there are no wicks or shadows. I wouldn't expect to see a serious pullback off of this configuration, despite my thoughts on Tuesday where these indicators suggested to me a bearish end to the week.
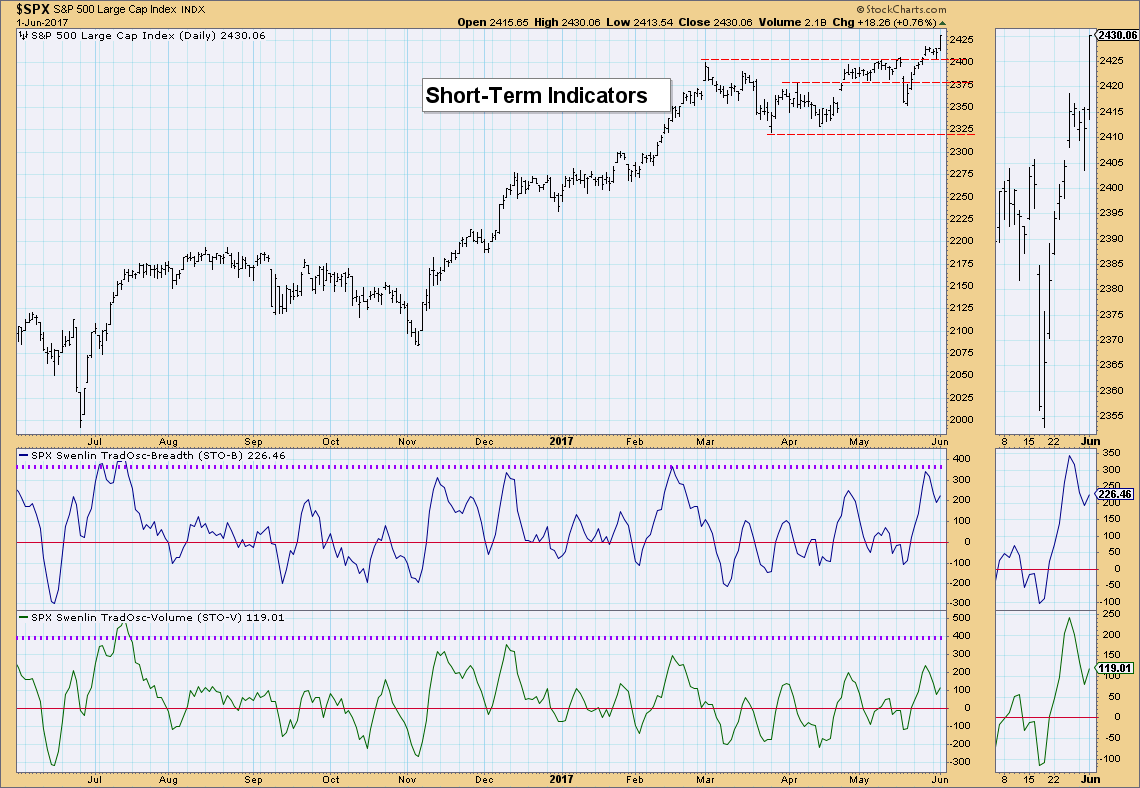
Short-Term Indicators: I mentioned during yesterday's MarketWatchers LIVE show that typically we will see overbought indicators unwind through lower prices. However, for most of the year, these indicators have been clearing overbought conditions through consolidation or in some instances without a price decline. This is characteristic of a strong bull market with plenty of internal strength. These indicators have turned back up, but they are still somewhat overbought and need to decompress. Given today's breakout, I'd say the market has plenty of internal strength to avoid a deep decline.
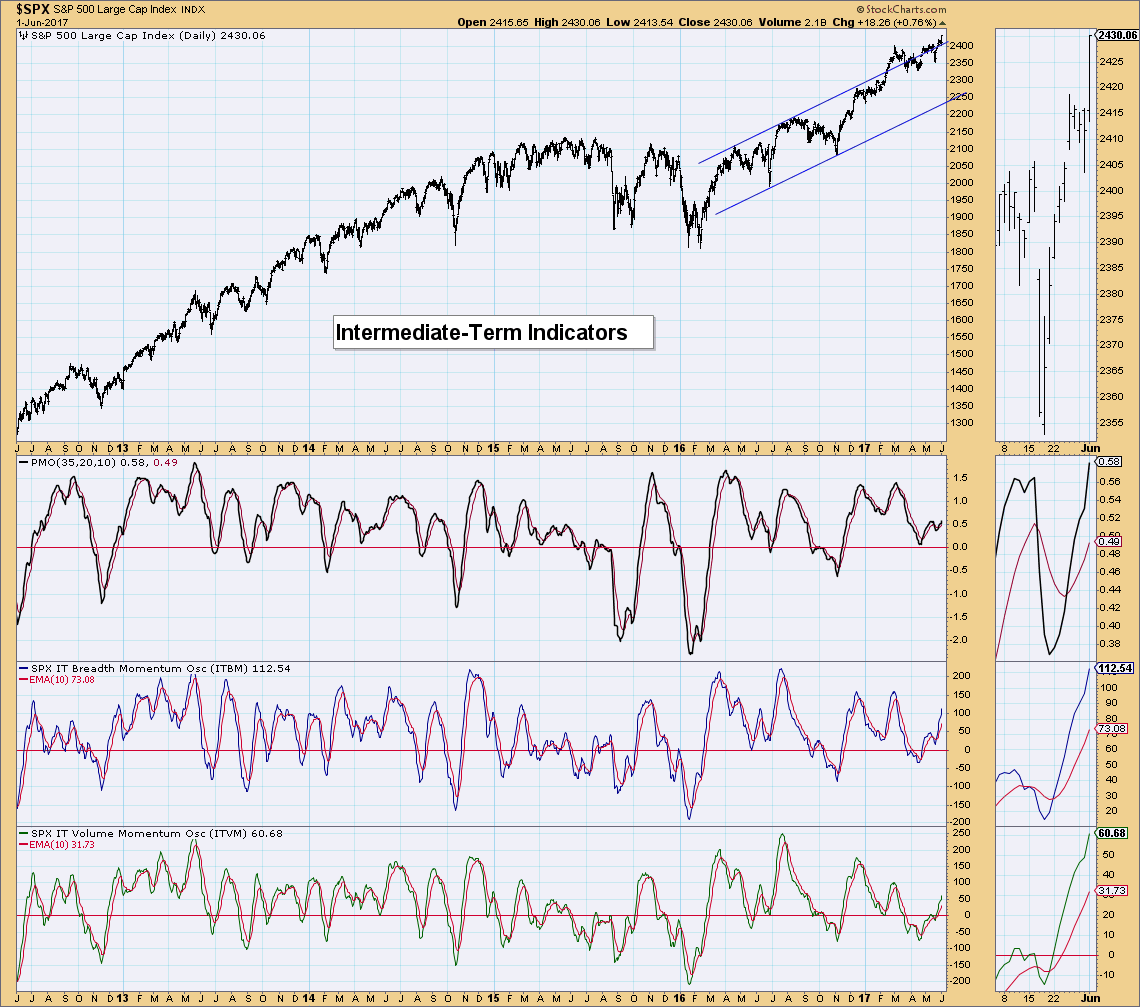
Intermediate-Term Indicators: These indicators are very bullish. They're rising strongly in positive territory but are far from being overbought.
Conclusion: It figures that after writing a blog title on Tuesday about a bearish finish on the week that we'd see this strong rally. Well, we didn't and the indicators were able to clear some of the overbought conditions with only consolidation. While ST indicators are still somewhat overbought, they do have room to move higher again before hitting extremes. However, it isn't a generous amount of time, they will need to decompress again soon. With so much internal strength in this market, I wouldn't expect a correction or even serious pullback. IT indicators tell us any price drop will likely be temporary as they are still rising and very bullish. . .
Click on "In reply to", for Authors past commentaries
Information posted to this board is not meant to suggest any specific action, but to point out the technical signs that can help our readers make their own specific decisions. Your Due Dilegence is a must! • DiscoverGold
Register for free to join our community of investors and share your ideas. You will also get access to streaming quotes, interactive charts, trades, portfolio, live options flow and more tools.


 News
News  Market Data
  Discover