>>> Revenue Beats Outpacing Earnings Beats <<< By Bespoke | May 22, 2017
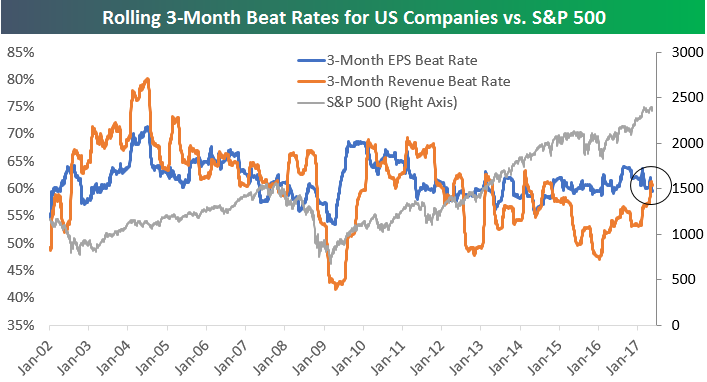
In the chart below, we show the rolling 3-month earnings and revenue beat rates over the last 15 years. In the mid-2000s, both top and bottom-line beat rates were generally higher than they are now. During the current bull market that began in March 2009, we initially saw a big spike higher in the earnings beat rate. We then saw a drift lower from 2010 through mid-2014, and since then we’ve seen an ever-so-slight uptrend emerge. For the revenue beat rate, we also saw a spike higher in the early days of the bull market, and then it trended lower from 2012 through early 2016. Since the start of 2016, the revenue beat rate has picked up significantly. Just this quarter, we’ve actually seen the revenue beat rate cross above the earnings beat rate, which hasn’t been the case since late 2014.
We’d much rather see a strong top-line (revenues) beat rate than a strong bottom-line (EPS) beat rate because revenue numbers are much more difficult for corporations to manufacture a “beat.” The general trend higher in the revenue beat rate over the last 18 months is bullish in our view.
Information posted to this board is not meant to suggest any specific action, but to point out the technical signs that can help our readers make their own specific decisions. Your Due Dilegence is a must! • DiscoverGold
Register for free to join our community of investors and share your ideas. You will also get access to streaming quotes, interactive charts, trades, portfolio, live options flow and more tools.


 News
News  Market Data
  Discover