:::: SPY - DecisionPoint Weekly Wrap :::: By Carl Swenlin | May 13, 2017
Rally Stalls
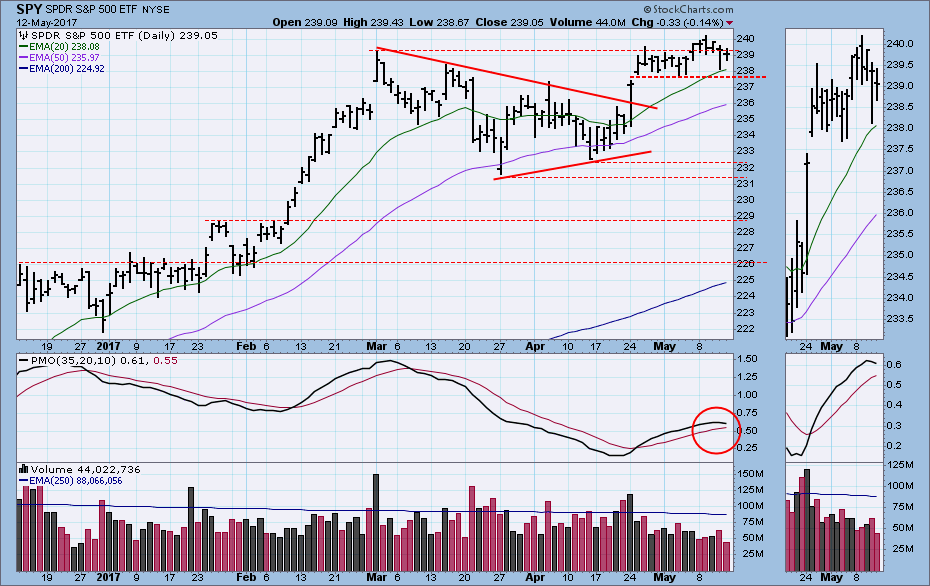
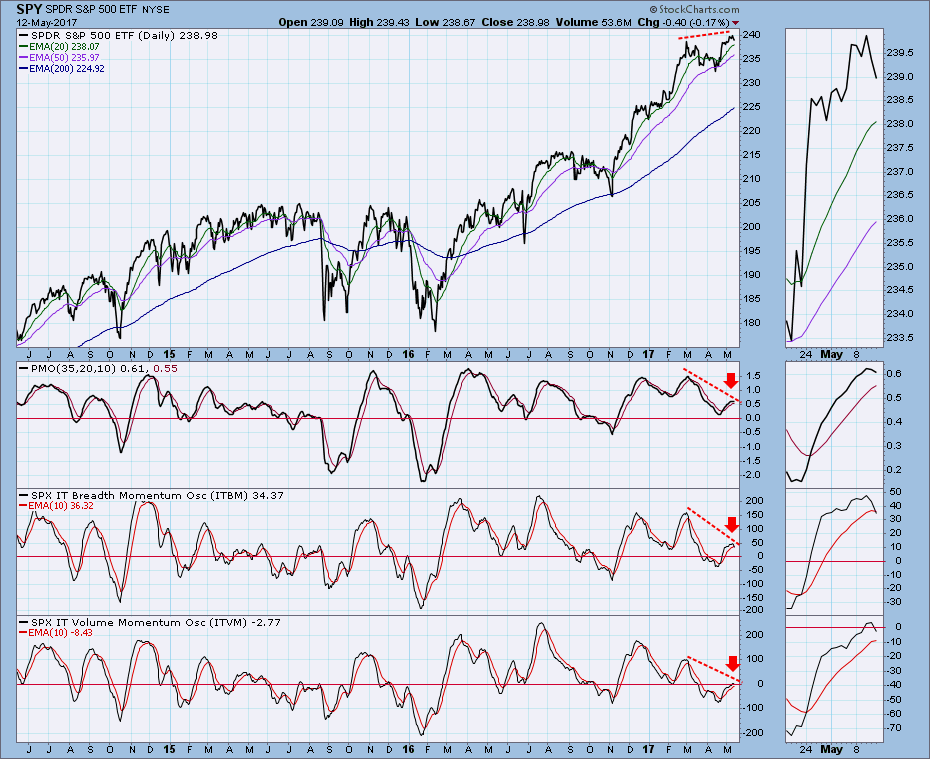
I thought that last week's breakout was the initiation of a new rally that would continue this week. But no. This week price moved back below the breakout level, but strangely this failure did not develop into a more serious breakdown either. Price just continued to churn sideways, which resulted in the PMO (Price Momentum Oscillator) turning down -- a very short-term SELL signal.
STOCKS
IT Trend Model: BUY as of 11/15/2016
LT Trend Model: BUY as of 4/1/2016
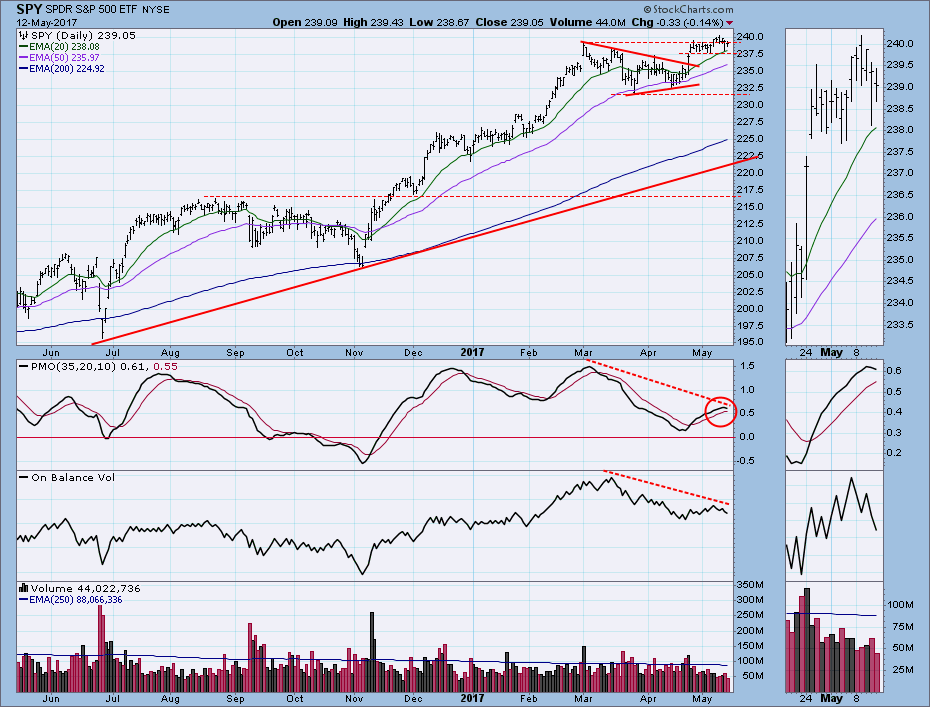
Price broke out through the top of a triangle formation in late April, but it has made virtually no progress since reaching the high set in March. There are negative divergences on OBV and on the PMO, which just topped.
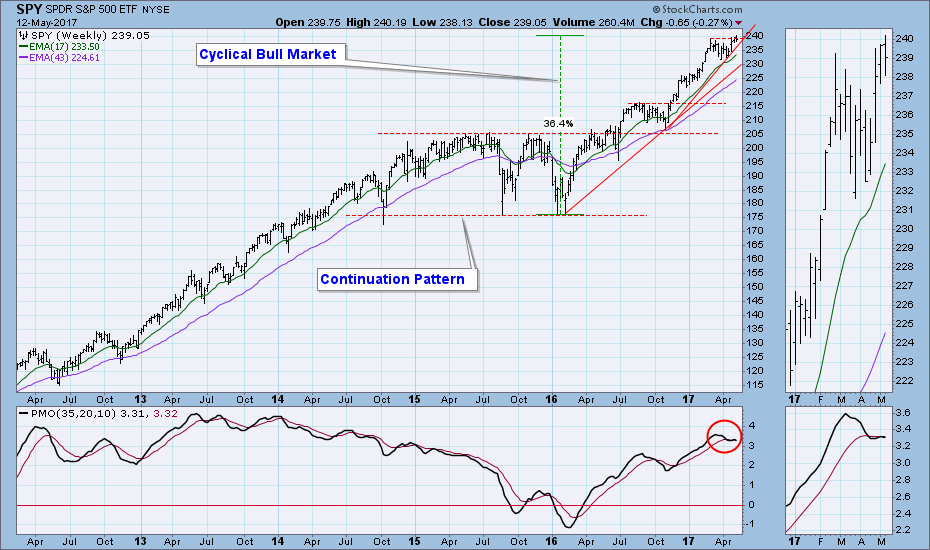
The weekly PMO is very close to topping below the signal line, which is a very negative configuration.
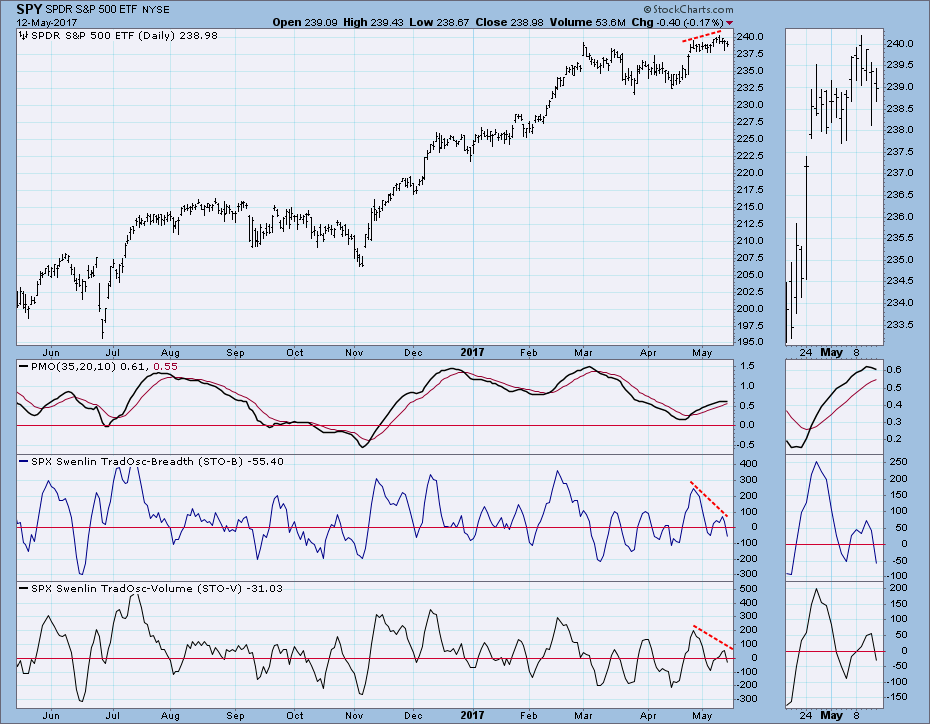
Short-Term Market Indicators: There are negative divergences across the two most recent short-term tops.
Intermediate-Term Market Indicators: More negative divergences, and the ITVM has topped very close to the zero line, emphasizing how weak volume has been.
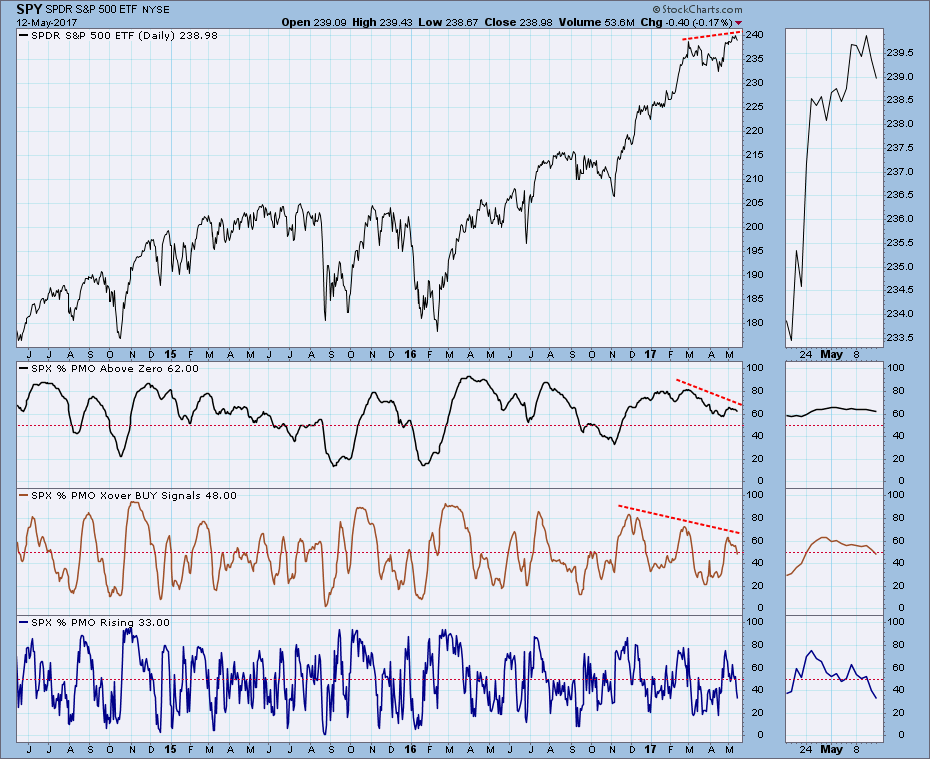
PMO Analysis: I don't usually include this chart, but I think it gives an important view of weakening internals. It shows the percentage of S&P 500 stocks whose PMOs are: (1) above zero, (2) above their signal lines (PMO crossover BUY signals), and (3) rising. The percentages are unusually low, considering that SPY is near all-time highs.
Conclusion: My optimism from last week has been considerably dampened by the market's failure to continue to rally after breaking out and making new, all-time highs. Indicators, which last week offered encouragement by being bull market oversold and rising, have now topped and have formed negative divergences against price. How can the outlook change so quickly? Well, we are positive when indicators begin moving up from relatively oversold levels -- they have plenty of room to accommodate higher prices before they start to become overbought. But the price advance has not materialized (yet?), and the indicators have now topped at levels that are still oversold by bull market standards. We don't want indicators topping while they are still oversold. It is dangerous. Because of this, I am am feeling very cautious about next week. . .
Click on "In reply to", for Authors past commentaries
Information posted to this board is not meant to suggest any specific action, but to point out the technical signs that can help our readers make their own specific decisions. Your Due Dilegence is a must! • DiscoverGold
Register for free to join our community of investors and share your ideas. You will also get access to streaming quotes, interactive charts, trades, portfolio, live options flow and more tools.


 News
News  Market Data
  Discover