May Historically a Solid Month in Post-Election Years By Almanac Trader | April 26, 2017
May has been a tricky month over the years, a well-deserved reputation following the May 6, 2010 “flash crash”. It used to be part of what we called the “May/June disaster area.” From 1965 to 1984 the S&P 500 was down during May fifteen out of twenty times. Then from 1985 through 1997 May was the best month, gaining ground every single year (13 straight gains) on the S&P, up 3.3% on average with the DJIA falling once and two NASDAQ losses.
In the years since 1997, May’s performance has been erratic; DJIA up nine times in the past nineteen years (three of the years had gains in excess of 4%). NASDAQ suffered five May losses in a row from 1998-2001, down – 11.9% in 2000, followed by ten sizable gains in excess of 2.5% and four losses, the worst of which was 8.3% in 2010. Post-election-year Mays rank at or near the top.
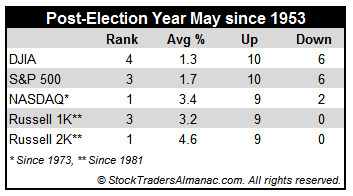
May is the top performing NASDAQ and Russell 2000 month in post-election years. The Russell 2000 has been up 9 straight with gains averaging a whopping 4.6%. DJIA and S&P 500 (since 1953) have been nearly as strong, with May ranking 4th and 3rd respectively.
May begins the “Worst Six Months” for the DJIA and S&P. To wit: “Sell in May and go away.” Our “Best Six Months Switching Strategy,” created in 1986, proves that there is merit to this old trader’s tale. A hypothetical $10,000 investment in the DJIA compounded to $843,577 for November-April in 66 years compared to $319 loss for May-October.
• DiscoverGold
Click on "In reply to", for Authors past commentaries
Information posted to this board is not meant to suggest any specific action, but to point out the technical signs that can help our readers make their own specific decisions. Your Due Dilegence is a must! • DiscoverGold
Register for free to join our community of investors and share your ideas. You will also get access to streaming quotes, interactive charts, trades, portfolio, live options flow and more tools.


 News
News  Market Data
  Discover