


| Followers | 680 |
| Posts | 141214 |
| Boards Moderated | 36 |
| Alias Born | 03/10/2004 |
Saturday, April 22, 2017 9:55:26 AM
Vive la Volatilite (Or, Let Them Eat Risk-Off Cookies!)
By Tushar Chande | April 22, 2017
The market chose to fret about French elections this week, because a string of recent elections have led to unexpected outcomes, even though US exposure to the French economy is quite small. Earnings season helped risk-on sectors gain this week, and risk-off groups waned. However, trader anxiety, doused early in the week, flared up again after the terrorist incident on Champs Elysees. As a famous French historical figure might have tweeted today, "Let them eat risk-off cookies!" (Yes that rhymes with Biscoff cookies. More on that later.)
Gold and bond are the traditional risk-off cookies traders reach for when their anxiety rises. We first look at the $SPX (S&P 500 Index) and its correlation to the $VIX index (see Chart 2). Note that the 14-day correlation is negative: so as anxiety drove the $VIX higher, stocks headed lower. During the same period, gold and bonds rose as $VIX rallied (see charts 3 and 4). Thus, bonds and gold provide sweet relief for trader anxiety.

Chart 2: The S&P 500 index (top chart) is compared to the $VIX index (bottom panel) using the 14-day correlation (middle panel). Notice that the correlation was negative during the recent selloff and during the consolidation earlier this year. In other words, as trader anxiety rose, the market consolidated or sold-off.

Chart 3: The gold futures continuous contract had a positive correlation to the $VIX index, rising as anxiety rose. Note the negative correlation between stocks and $VIX in Chart 2.

Chart 4: The TLT iShares 20+ year Treasury Bond ETF has a positive correlation to the $VIX, quite similar to the correlation between gold and $VIX in Chart 3.
The S&P 500 Daily Bear (3x) fund roughly followed our outline from earlier this week for the head-and-shoulders pattern we identified on Monday, but still has not closed below the neckline (Chart 5). As the bearish sentiment declined, risk-on sectors gained and risk-off sectors waned (see chart 6). For example, CSX was a star on earnings, breaking out to new highs.

Chart 5: The SPXS ETF followed our head-and-shoulders template from Monday, but has not closed below the neckline in order to complete the pattern. (See updated chart here.)

Chart 6: Risk-off sectors (consumer staples, health care and utilities) declined, and risk-on groups (technology, industrials, materials and cyclicals) rallied.
In another sign that risk-off stocks were losing steam, Phillip Morris (PM) fell sharply (See Chart 7). I have marked two other important gaps-down that signaled key changes in market sentiment. Observe that PM had moderate-to-high correlation to bonds (risk-off favorite) and it had a positive correlation to the $VIX index. Thus, PM is a proxy for risk-off sentiment when it rises. Thus, the sharp gap down this week is interesting. PM must now fall through support at 108 to confirm the change in sentiment.
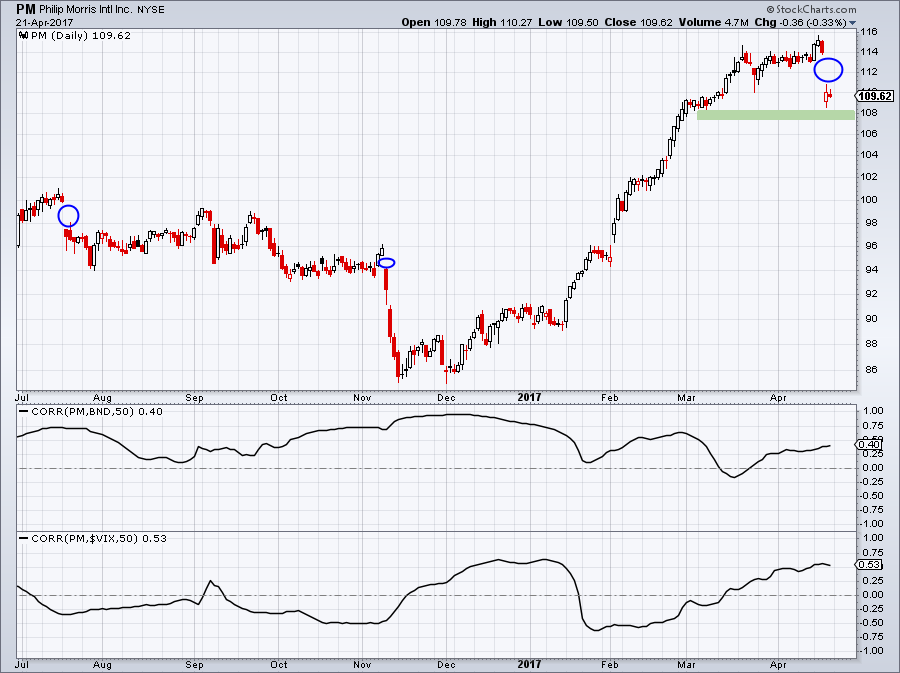
Chart 7: PM is a favorite during risk-off periods (note the positive correlation to bonds and $VIX), and the large gap-down this week may be a sign of changing market sentiment. Only broken support at 108 would confirm the change to risk-on mode. (See updated PM chart here.)
Market's Path of Least Resistance and Trend Following Model Check
The market's path of least resistance remains lower in the short- to -medium time frame, and higher in the long-term time frame. The intermediate-term is teetering on edge, and the trading next week will be important to see which side it comes down.

Chart 8: The roll-up of Russell-1000 stocks indicates negative sentiment in the short-and-medium term, with the long-term environment still positive. The intermediate-term is delicately poised, and could settle either way, depending on trading next week. Trend-following models are long bonds and gold in the short-to-intermediate term, and will not start to turn unless there are big moves next week. The dollar is slumping, but that could change come Monday.

Chart 9: Bonds and gold are in risk-off mode along with the SPX and dollar is unloved.

Chart 10: The trend-check carpet shows mixed trends but overall weakness in the short-term, with long-term models still pointing higher. The medium-term and intermediate-term models are mixed. The degree of smoothing increases from top to bottom. Index breadth increases from left to right, from 30 to over 2000 stocks.
The Top-6 S&P 500 stocks ranked by Chande Trend Meter are shown in Chart 11. The mixture is diverse, and driven by recent earnings.

Chart 11: The top trending S&P 500 stocks as measured by the Chande Trend Meter.
Looking Ahead
The market's reactions on Monday are impossible to forecast. This week the market tried to move higher. So, to be contrarian, we look at the down-side risks, and find that there are at least three ways to project good support around 2300 in the $SPX (see Chart 12). If the market likes the results of the French election, then expect a push higher, with the QQQ within spitting distance of new highs.

Chart 12: I found at least three ways to estimate substantial support for the $SPX round 2300, should the French elections produce an unpleasant surprise. The breakout at 2300 is natural chart support, which also seems to coincide with Fibonacci pull-back levels drawn from two recent lows that traders are likely to use. Ideally, the results will be benign, and the market will fall through the neckline in Chart 5 and risk-on roughnecks will rule. (See updated SPX chart here.)
http://stockcharts.com/articles/chande/2017/04/vive-la-volatilite-or-let-them-eat-risk-off-cookies.html
• DiscoverGold
Information posted to this board is not meant to suggest any specific action, but to point out the technical signs that can help our readers make their own specific decisions. Your Due Dilegence is a must!
• DiscoverGold
Join the InvestorsHub Community
Register for free to join our community of investors and share your ideas. You will also get access to streaming quotes, interactive charts, trades, portfolio, live options flow and more tools.

