


| Followers | 689 |
| Posts | 143817 |
| Boards Moderated | 35 |
| Alias Born | 03/10/2004 |
Thursday, April 20, 2017 8:09:33 AM
Three Peaks and a Domed House Top In Play Again
By Almanac Trader | April 20, 2017
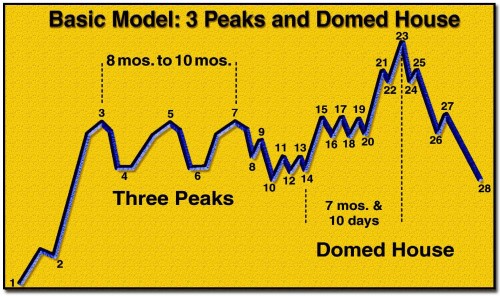
Our old esoteric chart pattern friend, the Three Peaks and a Domed House Top pattern (3PDH), is potentially in play again. Below is our latest plotting of this arcane yet uncannily accurate chart pattern as it currently may be playing out on the S&P 500. But first a brief profile on the 3PDH.
The Three Peaks and a Domed House pattern was developed back in 1968 by the late, great technician George Lindsay, really a technical analysis savant genius. Lindsay’s research found that the market followed this pattern “at least 60% of the time” and that “the majority of all major advances ended in a pattern which resembled the Three Peaks and a Domed House.” This recurring market pattern occurs at nearly every major U.S. equity market top and articulates consistent market behavior.
The 3PDH chart pattern demonstrates how markets tend to come off a low and move up until a resistance point is reached (point 3). Then after two attempts to move higher (points 5 and 7) there is a sell-off to point 10. This is the “Separating Decline” that separates the Three Peaks from the Domed House. Point 10 is always lower than either point 4 or 6, often both. If is not lower it does not qualify and the pattern is nullified. The Domed House starts with a base between points 10 and 14. A rally usually ensues and forms another higher base (points 15 to 20, Roof of the First Story). Then from there the final surge to the high creates the Dome from points 21 to 25. The drop-off returns to the vicinity of point 10.
Minor and major formations of Three Peaks and a Domed House often overlapped with a Peak of one being a Dome of another. Sometimes Three Peaks followed a Domed House. Some tops could not be fit into the pattern and do not qualify. In some instances points 25 or 27 were higher than the point 23 Domed House Top.
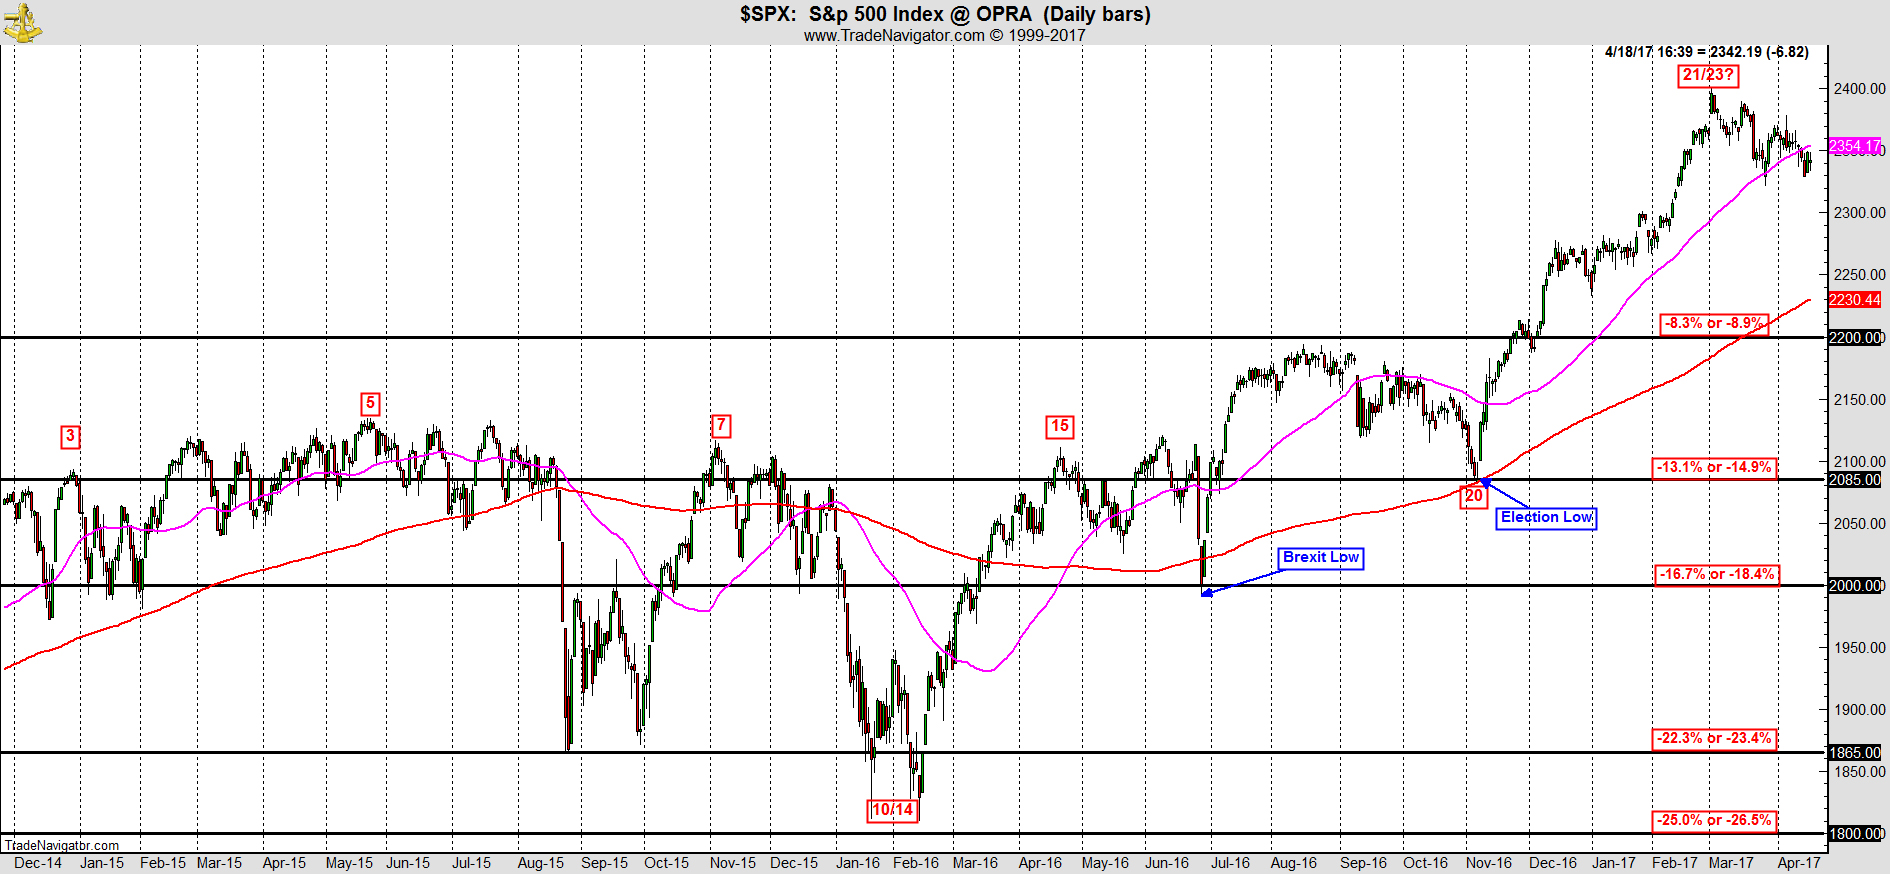
Our most recent successful use of the pattern began in October 2014 with timely and prudent follow up in July 2015 that came to completion in the summer of 2015 with the global financial crises fueled market carnage in August and September of that year. We began tracking the current count in August 2016. This is a recount of that with point 3 being moved back to the late December 2014 high, points 4-15 remaining the same and a recount from there on out.
Correlating the current chart of the S&P 500 with the Basic Model above, the recent high on March 1 could be point 21 or even point 23. In either case a bounce slightly higher to a point 23 Domed House Top or even at point 25 or 27 seems likely given the historical seasonal prowess of the month of April and the propensity for markets to lose steam in May as well as the current technical setup for an oversold bounce.
We have added a few key major support levels or levels any major correction or bear market could bring the S&P back to at: the November 2016 Election Low ~2085, the Brexit Low ~2000, the Point 10 Low ~1865 and big round 1800 below them all. We do not expect the 20%+ bear this year – though that could change if things deteriorate.
http://jeffhirsch.tumblr.com/post/159766934548/three-peaks-and-a-domed-house-top-in-play-again
• DiscoverGold
Click on "In reply to", for Authors past commentaries
By Almanac Trader | April 20, 2017

Our old esoteric chart pattern friend, the Three Peaks and a Domed House Top pattern (3PDH), is potentially in play again. Below is our latest plotting of this arcane yet uncannily accurate chart pattern as it currently may be playing out on the S&P 500. But first a brief profile on the 3PDH.
The Three Peaks and a Domed House pattern was developed back in 1968 by the late, great technician George Lindsay, really a technical analysis savant genius. Lindsay’s research found that the market followed this pattern “at least 60% of the time” and that “the majority of all major advances ended in a pattern which resembled the Three Peaks and a Domed House.” This recurring market pattern occurs at nearly every major U.S. equity market top and articulates consistent market behavior.
The 3PDH chart pattern demonstrates how markets tend to come off a low and move up until a resistance point is reached (point 3). Then after two attempts to move higher (points 5 and 7) there is a sell-off to point 10. This is the “Separating Decline” that separates the Three Peaks from the Domed House. Point 10 is always lower than either point 4 or 6, often both. If is not lower it does not qualify and the pattern is nullified. The Domed House starts with a base between points 10 and 14. A rally usually ensues and forms another higher base (points 15 to 20, Roof of the First Story). Then from there the final surge to the high creates the Dome from points 21 to 25. The drop-off returns to the vicinity of point 10.
Minor and major formations of Three Peaks and a Domed House often overlapped with a Peak of one being a Dome of another. Sometimes Three Peaks followed a Domed House. Some tops could not be fit into the pattern and do not qualify. In some instances points 25 or 27 were higher than the point 23 Domed House Top.
Our most recent successful use of the pattern began in October 2014 with timely and prudent follow up in July 2015 that came to completion in the summer of 2015 with the global financial crises fueled market carnage in August and September of that year. We began tracking the current count in August 2016. This is a recount of that with point 3 being moved back to the late December 2014 high, points 4-15 remaining the same and a recount from there on out.
Correlating the current chart of the S&P 500 with the Basic Model above, the recent high on March 1 could be point 21 or even point 23. In either case a bounce slightly higher to a point 23 Domed House Top or even at point 25 or 27 seems likely given the historical seasonal prowess of the month of April and the propensity for markets to lose steam in May as well as the current technical setup for an oversold bounce.
We have added a few key major support levels or levels any major correction or bear market could bring the S&P back to at: the November 2016 Election Low ~2085, the Brexit Low ~2000, the Point 10 Low ~1865 and big round 1800 below them all. We do not expect the 20%+ bear this year – though that could change if things deteriorate.

http://jeffhirsch.tumblr.com/post/159766934548/three-peaks-and-a-domed-house-top-in-play-again
• DiscoverGold
Click on "In reply to", for Authors past commentaries
Information posted to this board is not meant to suggest any specific action, but to point out the technical signs that can help our readers make their own specific decisions. Your Due Dilegence is a must!
• DiscoverGold
Join the InvestorsHub Community
Register for free to join our community of investors and share your ideas. You will also get access to streaming quotes, interactive charts, trades, portfolio, live options flow and more tools.

