


| Followers | 689 |
| Posts | 143817 |
| Boards Moderated | 35 |
| Alias Born | 03/10/2004 |
Tuesday, April 18, 2017 9:11:07 AM
Fear Index Drops To Lower Gear
By Tushar Chande | April 17, 2017
The $VIX index closed below its prior two lows today. It's 7-day RSI has dropped below 70. In the past this has generally turned into an important reversal in the VIX index. Today, key market indexes and sub-sectors, such as the NYSE composite and XLF held support and bonds (and gold) reversed. A typical unwinding of the defensive selling ahead of the long weekend, a possibility I had suggested at the end of my previous post. I look at a few charts to understand if the reversal could continue.
$VIX Closes Below Two Previous Lows
In my post this weekend, I had suggested that the event-risk selling should reverse if the weekend closed quietly. Fortunately, that is just what happened, and the VIX closed below its two prior lows (see Chart 1). This probably marks the start of a reversal away from recent lows. However, note that there is an uptrend line from the February lows on the $VIX chart, hence it must close below 11 to reverse that trend.
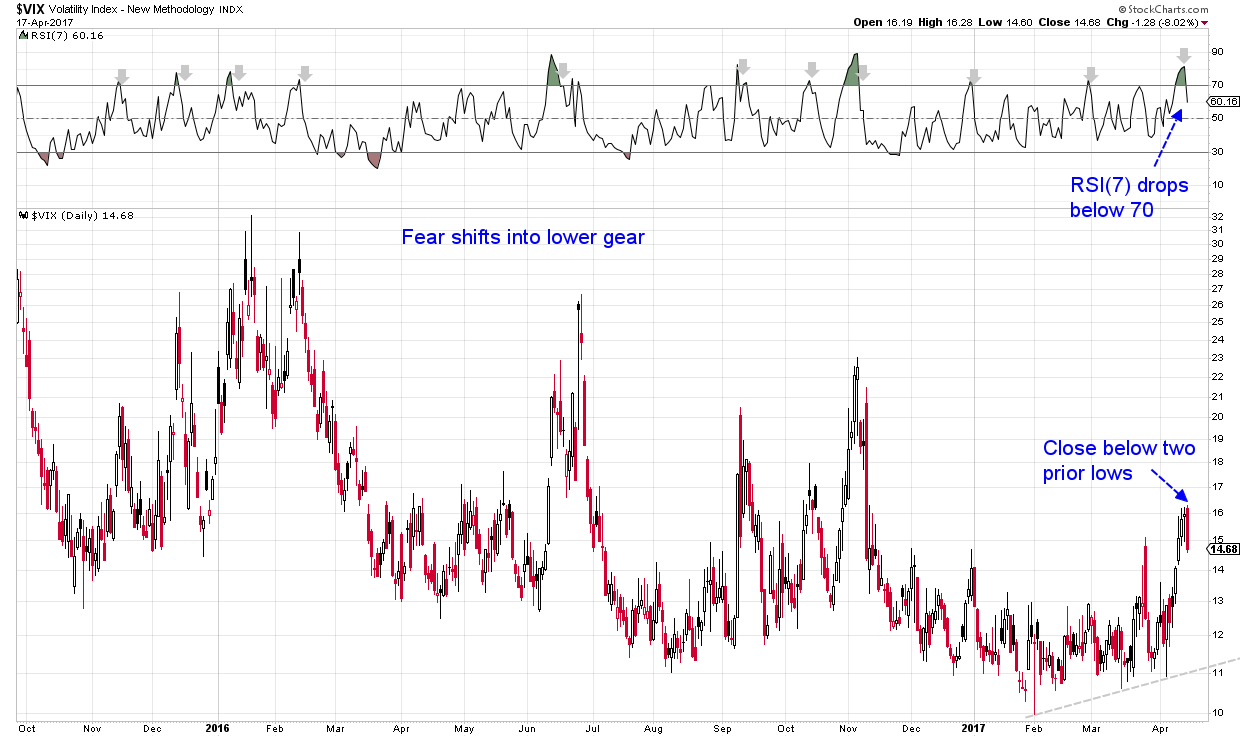
Chart 1: The $VIX index closed below its two prior lows and its 7-day RSI dropped below 70 after first rising above 70. In the past, this has marked a turning point. However, note that the VIX has been rising steadily since February, and only a close under 11 will mark a reversal of that trend.
SPXS ETF Forms Head-And-Shoulders Pattern
Further support for the idea of a short-term bottom comes from the 2-hour chart of the SPXS (Direxion Daily S&P 500 Bear 3x) ETF. This ETF rises when the market drops, and represents a bearish bet on the market. The very-short term chart suggests a head-and-shoulders pattern, with today being the right shoulder. Clearly, SPXS must drop below the neckline in order to complete the pattern (see Chart 2).
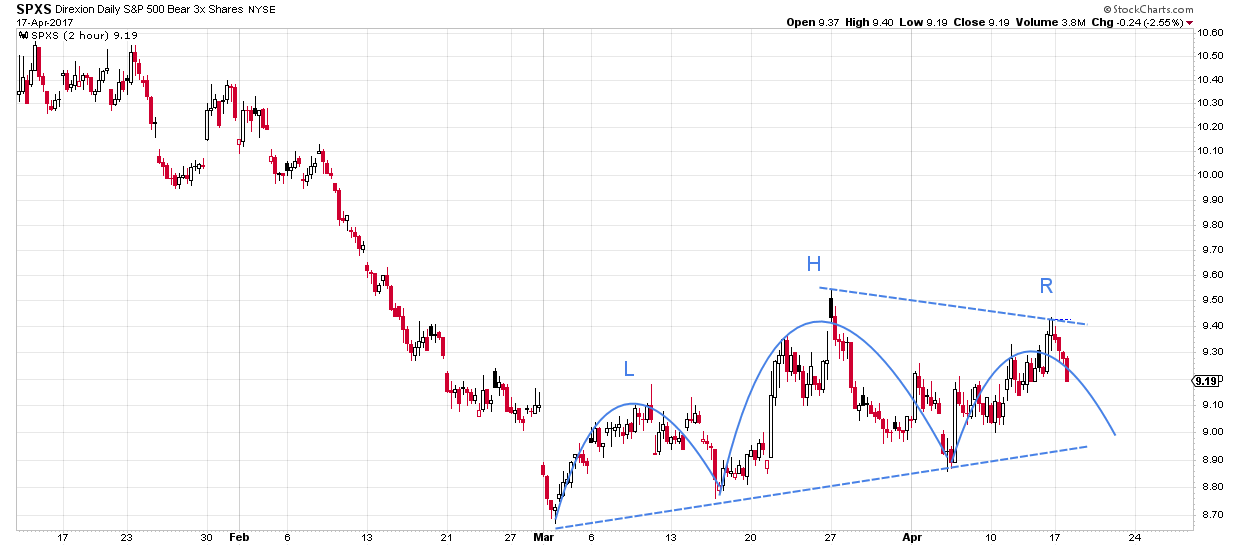
Chart 2: The Direxion Daily S&P 500 Bear 3x ETF (SPXS) has formed a head-and-shoulders pattern on the short-term 2-hour chart. Today's action potentially forms the right shoulder, but the ETF must drop below the neckline to complete the pattern.
Treasury Bonds Pause Their Recent Rally
The third piece of data supporting a potential reversal is that the TLT (iShares 20+ year Treasury Bond) ETF has reached resistance at 124 and pulled back today (see Chart 3). Clearly, the resistance at 124 must hold for the reversal to gain a firmer footing and for stocks to rally (since stock and bond prices are negatively correlated at the moment).
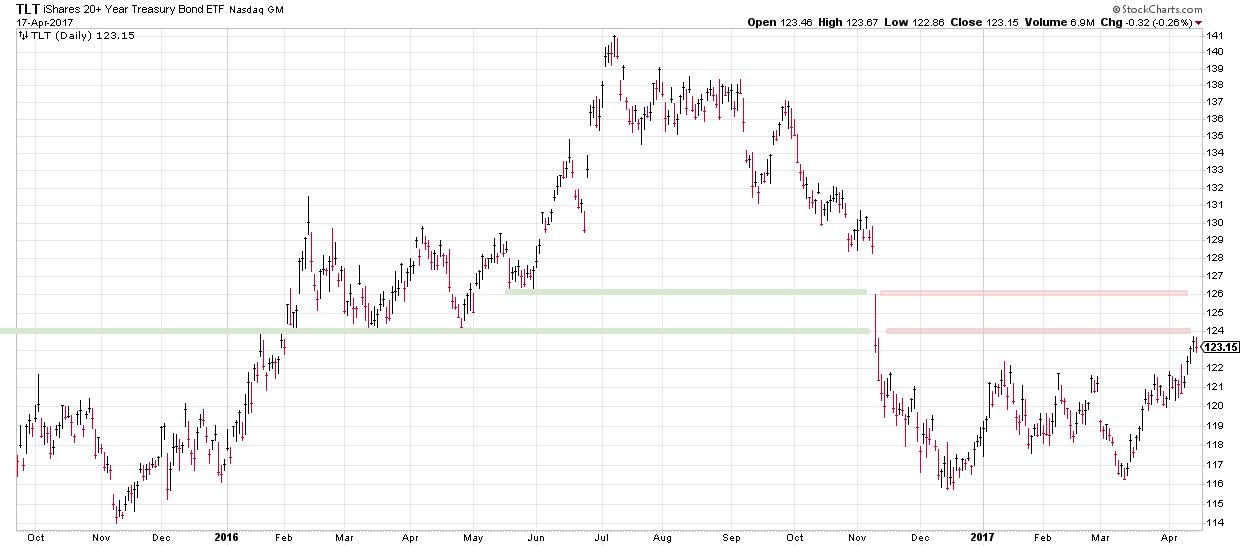
Chart 3: The TLT (iShares 20+ year Treasury Bond) ETF has met resistance at 124 that represents prior support from this time last year.
Financials Hold Crucial Support
Financials as a group have borne the brunt of the selling in this downturn. The Financial Select Sector SPDR held crucial support at 23 (see Chart 3), and on this 60-minute chart, one can comfortably draw a divergence using the 14-bar RSI. The 200-bar stochastic RSI has still to recover, so more work is needed to establish the reversal. If XLF could move above the down-trend line, that would be a positive for the market as a whole.
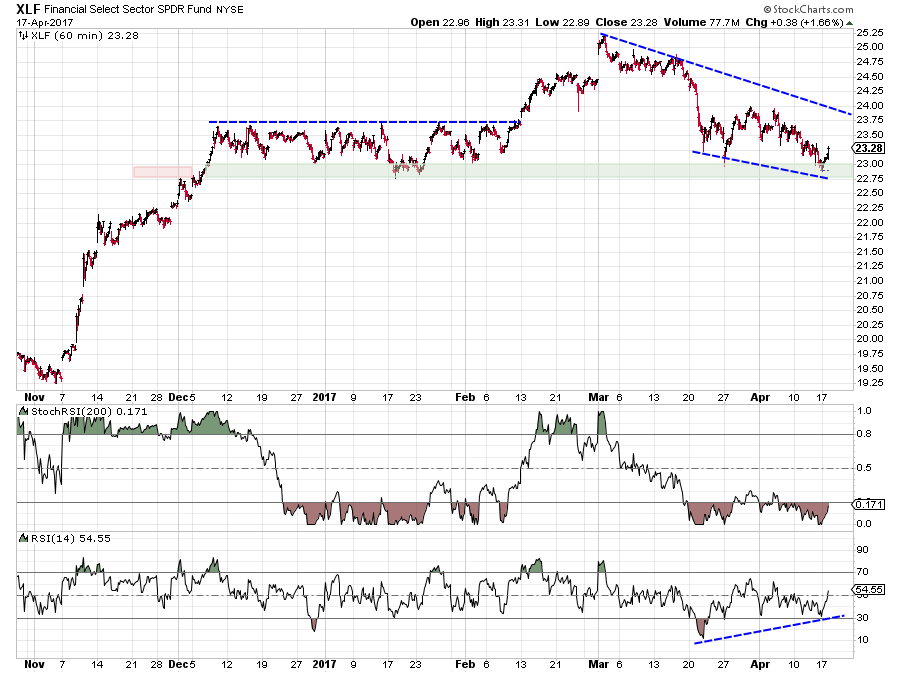
Chart 3: The all-important XLF SPDR ETF, representing one of the worst-hit sectors, held crucial support at 22.75-23.00, and one can even draw a small positive divergence using the 14-period RSI. The 200-bar stochastic RSI is still below 0.20, so XLF needs to rise above 24 to confirm a short-term bottom.
Other Key Indexes Hold Support
The S&P 500 index held support, as did the more broadly based NYSE composite (see Chart 4). The Dow closed above the previous high. So, the rally was broad-based, and helped critical sectors such as Financials.
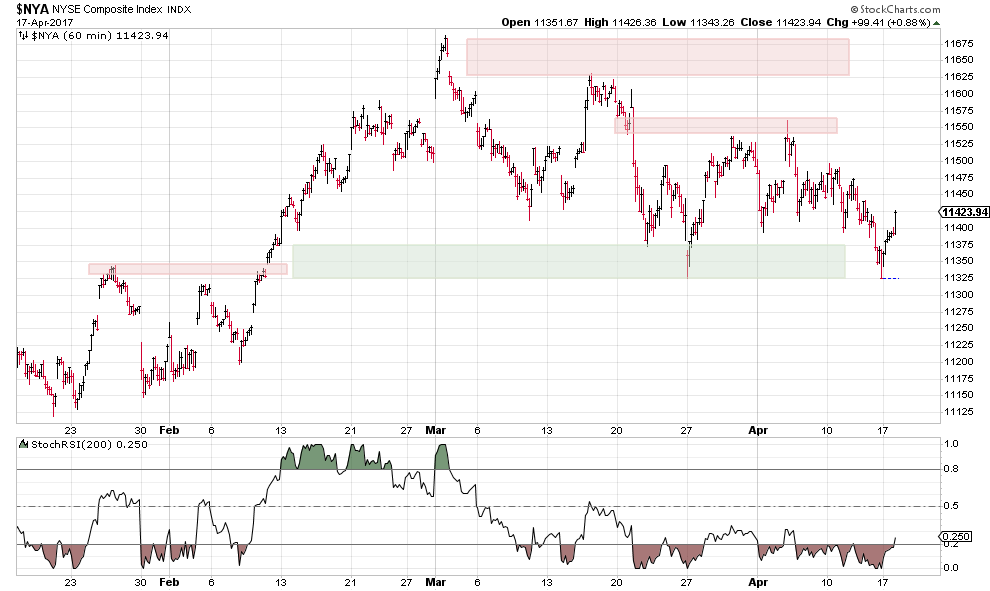
Chart 4: The broad-based NYSE composite held support at 11,325, but must work up to and push through resistance at 11,550 as the next important basing step.
Summary
A fairly typical relief rally after defensive selling going into the long weekend as I had suggested my prior post. The action of the $VIX suggests the market could make the reversal stick.
http://stockcharts.com/articles/chande/2017/04/fear-index-drops-to-lower-gear-.html
• DiscoverGold
Information posted to this board is not meant to suggest any specific action, but to point out the technical signs that can help our readers make their own specific decisions. Your Due Dilegence is a must!
• DiscoverGold
Join the InvestorsHub Community
Register for free to join our community of investors and share your ideas. You will also get access to streaming quotes, interactive charts, trades, portfolio, live options flow and more tools.

