• SPX Monitoring purposes; Long SPX on 4/12/17 at 2344.93. • Monitoring purposes Gold: Long GDX on 4/13/17 at 24.54. • Long Term Trend monitor purposes: Neutral.
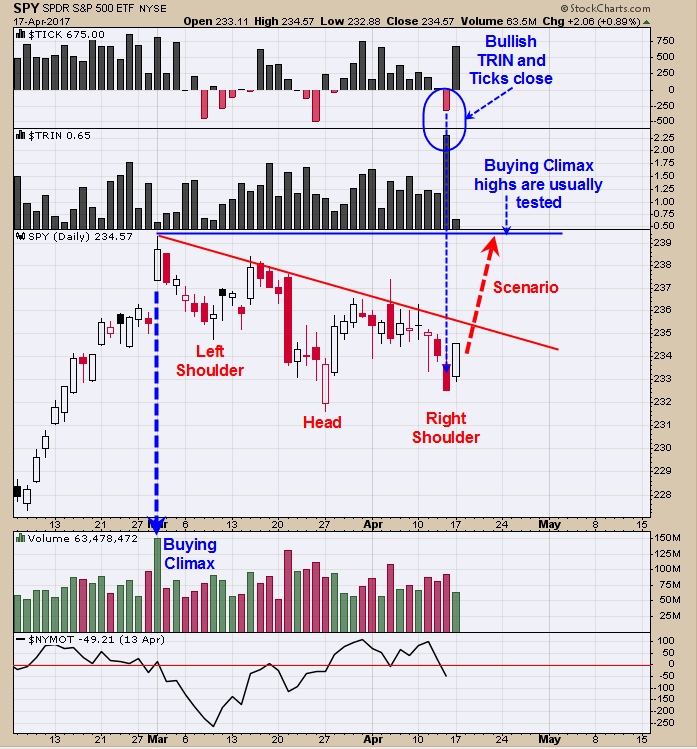
Last Thursday, the TRIN closed at 2.29 and the Ticks closed at -315 and that combination suggests a bottom will form the same days as the reading to as late as two days later which is Tomorrow (looks like last Thursday was the low). The pattern that appears to be forming is a Head and Shoulders bottom where the Head is the March 27 low and the Right Shoulder appears to have completed last Thursday. On March 1 a Buy Climax was recorded and most Buy Climaxes high are tested at some point. The High on March 1 came in near the 2400 range on the SPX and for the moment is our upside target. Long SPX on 4/13/17 at 2344.93.
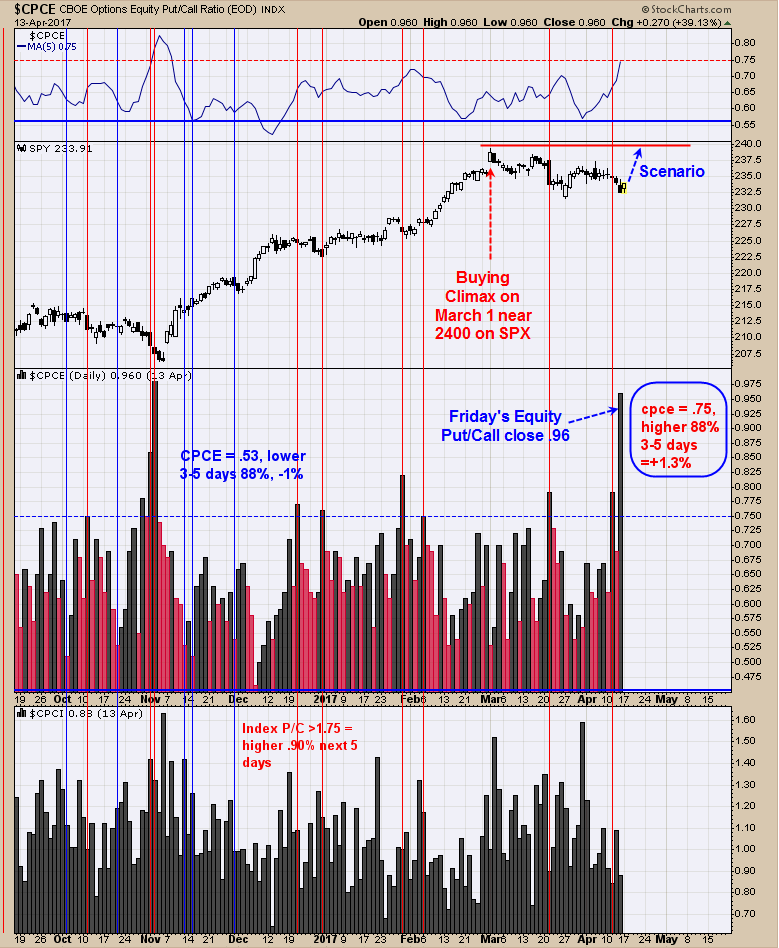
Thursday’s bullish TRIN close of 2.29 and the Tick close of -315 suggest a bottom the same day as the reading to as late a two day’s later which would be tomorrow. With today’s rise the bottom appears to have occurred on Thursday. Above is the Equity put/call ratio (second window up form bottom). When this ratio closes above .75, this condition predicts the market will rally 88% of the time in the next 3 to five days with an average gain of 1.3% . Thursday’s Equity Put/Call ratio closed at .98. Looks like option expiration week (this week) could be up. Long SPX on 4/12/17 at 2344.93.
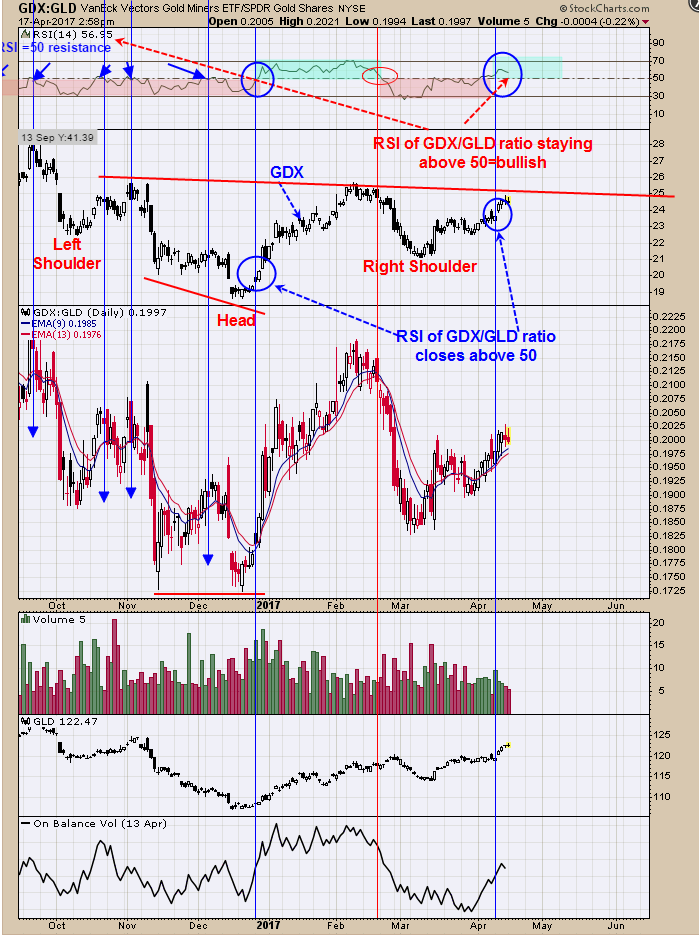
The top window is the RSI for GDX/GLD ratio. Readings above 50 are bullish and below 50 bearish and today’s reading came in at 56.95, and remains bullish. We have circled in blue on the GDX chart where buy signals were triggered by the RSI of the GDX/GLD ratio rising above 50. As long as the RSI stays above 50, the bullish move in GDX/GLD ratio is expected to continue, which in turn suggests GDX should move up also. The pattern forming on GDX (Second window down from top) could be a Head and Shoulders bottom which has an upside target to the August 2016 high near 31. Long GDX on 4/13/17 at 24.54.
Click on "In reply to", for Authors past commentaries
Information posted to this board is not meant to suggest any specific action, but to point out the technical signs that can help our readers make their own specific decisions. Your Due Dilegence is a must! • DiscoverGold
Register for free to join our community of investors and share your ideas. You will also get access to streaming quotes, interactive charts, trades, portfolio, live options flow and more tools.


 News
News  Market Data
  Discover