


| Followers | 679 |
| Posts | 141062 |
| Boards Moderated | 36 |
| Alias Born | 03/10/2004 |
Friday, April 14, 2017 4:28:00 PM
==> Weekly Market Summary
By Urban Carmel | April 14, 2017
Summary: US indices closed lower this week, but not by much. SPX lost just 1% and is just 3% from its all-time high. A number of notable short-term extremes in sentiment, breadth and volatility were reached on Thursday that suggest equities are at or near a point of reversal higher. The best approach is to continue to monitor the market and adjust with new data. That said, it's a good guess that SPX still has further downside in the days/weeks ahead.
* * *
Our last several posts have emphasized several points:
Strong uptrends (like this one) weaken before they reverse, meaning the current sell off is unlikely to lead directly into a major correction.
Even years with powerful returns (like 2013) experience multiple drawdowns of 3-8% along the way, meaning the current sell off was due and is perfectly normal.
There are a number of compelling studies suggesting that 2017 will continue to be a good year for US equities, meaning equities will likely end the year higher.
Read more on these points here and here.
SPX ended the week at 2328, 3% off it's all-time high (ATH) made on March 1. That is a very mild drawdown. Our post last week argued that a sell off to at least the 2300 area (4% off the ATH) was likely. From that respect, a lower low is likely to still lie ahead. That post is here.
There were a number of notable short-term extremes in sentiment, breadth and volatility reached on Thursday that suggest a rebound in equities is ahead. Let's review these.
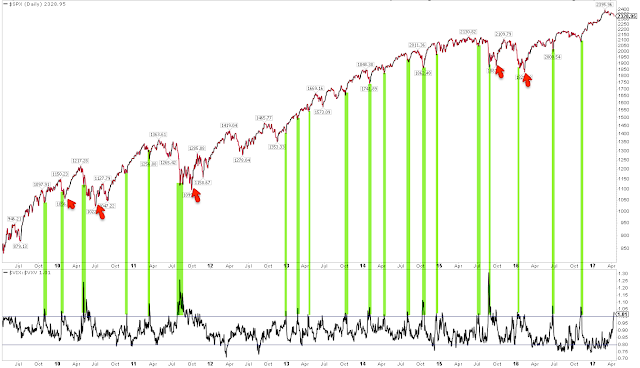
First, the equity-only put/call ratio reached a rare extreme on Thursday, with nearly as many puts as calls being traded on the day. That has happened only about a dozen times in the past 8 years. All of these have been at or near a short-term low in SPX (green lines). A rebound is likely ahead. That rebound might not last long, however: note that in several instances, the low was retested or exceeded in the days/weeks ahead (red arrows). Enlarge any chart by clicking on it.

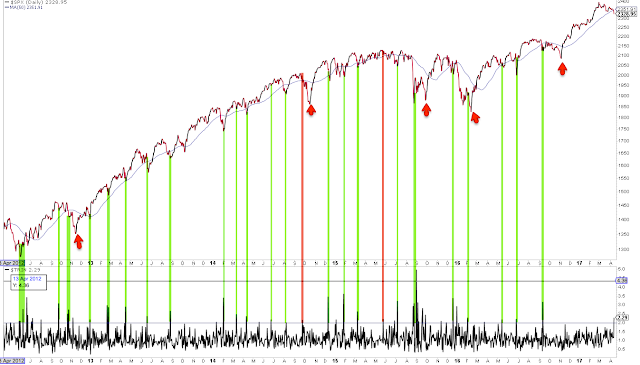
Second, Trin (also called the Arms Index) closed above 2.0 on Thursday. Trin is a breadth indicator derived by dividing the advance-decline ratio for issues by that for volume. A close over 2 means that down-volume was twice down-issues; in other words, stocks fell on relatively high volume.
A spike higher in Trin like yesterday's can often be near a low in equities. That is particularly true when the spike higher in Trin has occurred after several days of selling, like now. In this case, a high in Trin marks capitulation. A relevant post on this indicator is here.
Similar spikes in Trin over the past 5 years are shown below. A rebound is likely ahead. But, like the put/call ratio discussed above, that rebound might not last long: note that in several instances, the low was retested or exceeded in the days/weeks ahead (red arrows). Take last September as an example: SPX rebounded to its 50-dma (blue line) before falling further into the November low.
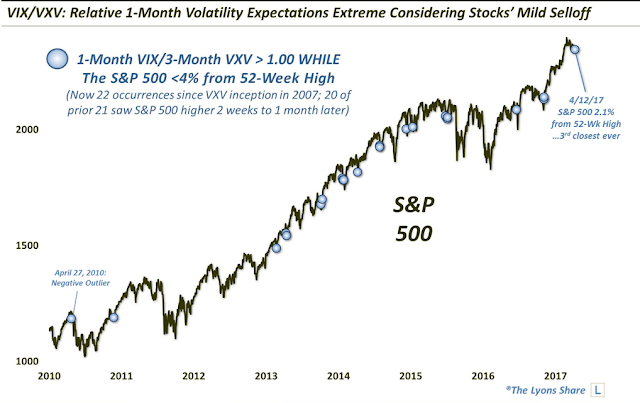
The third short-term extreme reached on Thursday was in the volatility term structure: when one-month protection is trading at a premium to three-month protection, equities have been at or near a point of reversal higher. Similar instances over the past 8 years are show below (green lines). Like the other two studies above, it is notable that the low was retested or exceeded in the days/weeks ahead in several instances (red arrows).
When the volatility term structure is in its current configuration and SPX is also near a 52-week high, equities have been higher 2-4 weeks later in all cases except one over the past decade (from Dana Lyons).
Finally, the VIX spiked up 24% this week, an extreme given that SPX lost only 1%. VIX has closed outside its upper Bollinger Band 4 days in a row. This has happened only 17 times since the year 2000, and in all cases except one, SPX was higher 2 days later by an average of more than 3% (from Kora Reddy).
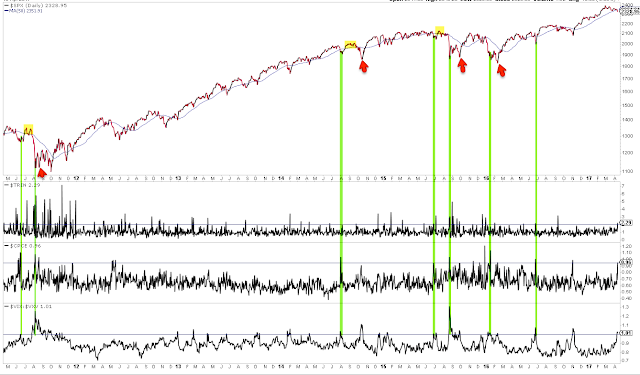
In summary, there were a number of short-term extremes reached on Thursday. Moreover, these all happened on the same day, which is even less usual. Prior instances are shown below (green lines). A rebound looks likely, but that doesn't necessarily mean that a lower low isn't ahead: again, it's notable that several of these failed in the days/weeks ahead (red arrows). Three cases where the rebound ended after the 50-dma (blue line) was retested are highlighted in yellow.
The best approach is to continue to monitor the market and adjust with new data. It will be a good sign if the SPX can regain its 50-dma and then regain its (falling) 13-ema. Uptrends are partially defined by the ability to stay overbought, so following momentum indicators (like RSI(5)) will be a good tell.
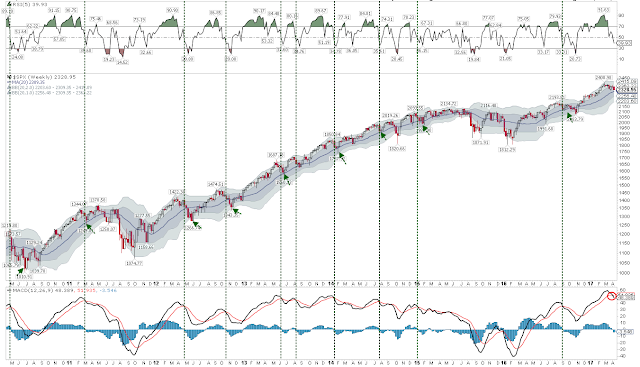
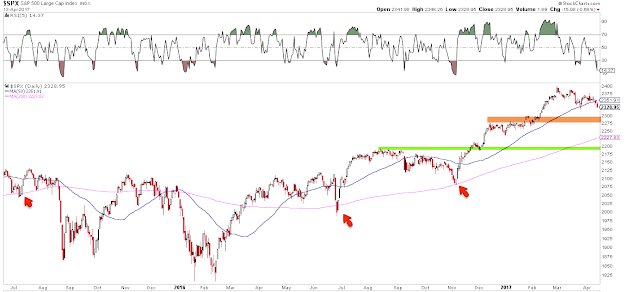
That said, it's a good guess that SPX has further downside ahead. The charts below are from last week: when SPX losses momentum (vertical lines), it then typically falls to its 20-wma or lower Bollinger (arrows), implying a move to 2300 to 2200, respectively (first chart). Those price levels correspond to strong support from last autumn and winter (second chart).
On the calendar this week: earnings reports start in earnest, industrial production is on Tuesday and options expiration is on Friday.
http://fat-pitch.blogspot.com/2017/04/weekly-market-summary_14.html
• DiscoverGold
Click on "In reply to", for Authors past commentaries
By Urban Carmel | April 14, 2017
Summary: US indices closed lower this week, but not by much. SPX lost just 1% and is just 3% from its all-time high. A number of notable short-term extremes in sentiment, breadth and volatility were reached on Thursday that suggest equities are at or near a point of reversal higher. The best approach is to continue to monitor the market and adjust with new data. That said, it's a good guess that SPX still has further downside in the days/weeks ahead.
* * *
Our last several posts have emphasized several points:
Strong uptrends (like this one) weaken before they reverse, meaning the current sell off is unlikely to lead directly into a major correction.
Even years with powerful returns (like 2013) experience multiple drawdowns of 3-8% along the way, meaning the current sell off was due and is perfectly normal.
There are a number of compelling studies suggesting that 2017 will continue to be a good year for US equities, meaning equities will likely end the year higher.
Read more on these points here and here.
SPX ended the week at 2328, 3% off it's all-time high (ATH) made on March 1. That is a very mild drawdown. Our post last week argued that a sell off to at least the 2300 area (4% off the ATH) was likely. From that respect, a lower low is likely to still lie ahead. That post is here.
There were a number of notable short-term extremes in sentiment, breadth and volatility reached on Thursday that suggest a rebound in equities is ahead. Let's review these.
First, the equity-only put/call ratio reached a rare extreme on Thursday, with nearly as many puts as calls being traded on the day. That has happened only about a dozen times in the past 8 years. All of these have been at or near a short-term low in SPX (green lines). A rebound is likely ahead. That rebound might not last long, however: note that in several instances, the low was retested or exceeded in the days/weeks ahead (red arrows). Enlarge any chart by clicking on it.

Second, Trin (also called the Arms Index) closed above 2.0 on Thursday. Trin is a breadth indicator derived by dividing the advance-decline ratio for issues by that for volume. A close over 2 means that down-volume was twice down-issues; in other words, stocks fell on relatively high volume.
A spike higher in Trin like yesterday's can often be near a low in equities. That is particularly true when the spike higher in Trin has occurred after several days of selling, like now. In this case, a high in Trin marks capitulation. A relevant post on this indicator is here.
Similar spikes in Trin over the past 5 years are shown below. A rebound is likely ahead. But, like the put/call ratio discussed above, that rebound might not last long: note that in several instances, the low was retested or exceeded in the days/weeks ahead (red arrows). Take last September as an example: SPX rebounded to its 50-dma (blue line) before falling further into the November low.

The third short-term extreme reached on Thursday was in the volatility term structure: when one-month protection is trading at a premium to three-month protection, equities have been at or near a point of reversal higher. Similar instances over the past 8 years are show below (green lines). Like the other two studies above, it is notable that the low was retested or exceeded in the days/weeks ahead in several instances (red arrows).

When the volatility term structure is in its current configuration and SPX is also near a 52-week high, equities have been higher 2-4 weeks later in all cases except one over the past decade (from Dana Lyons).

Finally, the VIX spiked up 24% this week, an extreme given that SPX lost only 1%. VIX has closed outside its upper Bollinger Band 4 days in a row. This has happened only 17 times since the year 2000, and in all cases except one, SPX was higher 2 days later by an average of more than 3% (from Kora Reddy).
In summary, there were a number of short-term extremes reached on Thursday. Moreover, these all happened on the same day, which is even less usual. Prior instances are shown below (green lines). A rebound looks likely, but that doesn't necessarily mean that a lower low isn't ahead: again, it's notable that several of these failed in the days/weeks ahead (red arrows). Three cases where the rebound ended after the 50-dma (blue line) was retested are highlighted in yellow.

The best approach is to continue to monitor the market and adjust with new data. It will be a good sign if the SPX can regain its 50-dma and then regain its (falling) 13-ema. Uptrends are partially defined by the ability to stay overbought, so following momentum indicators (like RSI(5)) will be a good tell.
That said, it's a good guess that SPX has further downside ahead. The charts below are from last week: when SPX losses momentum (vertical lines), it then typically falls to its 20-wma or lower Bollinger (arrows), implying a move to 2300 to 2200, respectively (first chart). Those price levels correspond to strong support from last autumn and winter (second chart).


On the calendar this week: earnings reports start in earnest, industrial production is on Tuesday and options expiration is on Friday.
http://fat-pitch.blogspot.com/2017/04/weekly-market-summary_14.html
• DiscoverGold
Click on "In reply to", for Authors past commentaries
Information posted to this board is not meant to suggest any specific action, but to point out the technical signs that can help our readers make their own specific decisions. Your Due Dilegence is a must!
• DiscoverGold
Join the InvestorsHub Community
Register for free to join our community of investors and share your ideas. You will also get access to streaming quotes, interactive charts, trades, portfolio, live options flow and more tools.

