Percent of Stocks Over 200-Day Average Turns Back Up By John Murphy | April 1, 2017
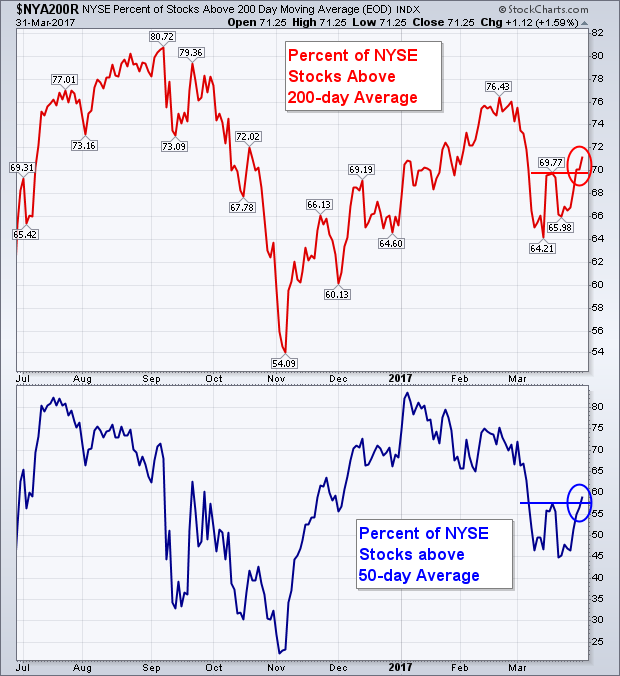
My last two messages have stressed the importance of the 200-day moving average. It's what separates uptrends from downtrends. In order to sustain a bull market, more stocks have be above their 200-day average than below it. And that is currently the case. The red line in Chart 5 is the percent of NYSE stocks above their 200-moving average (which I also showed on Thursday). The line rebounded from 54% just prior to the November election to 76% during February. March's modest setback lowered the line to 64% where it bottomed. This week's upturn shows the red line rising again. That's a good sign for the market. It may also be a good sign for the stocks that are testing or trying to regain their 200-day averages. The blue line at the bottom of Chart 5 shows the percent of NYSE stocks above their 50-day average. That more volatile line fell from 80% to 45% during the first quarter which is a relatively mild setback. And it appears to be climbing again as well. Also good for stocks.
Click on "In reply to", for Authors past commentaries
Information posted to this board is not meant to suggest any specific action, but to point out the technical signs that can help our readers make their own specific decisions. Your Due Dilegence is a must! • DiscoverGold
Register for free to join our community of investors and share your ideas. You will also get access to streaming quotes, interactive charts, trades, portfolio, live options flow and more tools.


 News
News  Market Data
  Discover