Following futures positions of non-commercials are as of February 28, 2017.
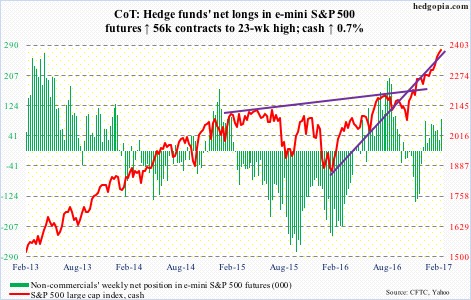
E-mini S&P 500: Stocks’ response to Tuesday’s State of the Union is eliciting phrases such as ‘blow off top’. Maybe, maybe not. Indeed, the S&P 500 (cash) rallied 12 percent since November 8 last year (election day). As insane as the move has been, every dip to 10- and 20-day moving averages has been gobbled up … so far. There likely will be another test next week.
Sentiment remains euphoric. The NAAIM exposure index was in the 90s in 13 of the last 14 weeks – five of them north of 100. Investors Intelligence bulls have been north of 55 in the last 15 weeks, with seven of them in the 60s.
These are abnormal readings, along with several others. On Wednesday, 84 percent of S&P 500 companies were above their 200-day moving average.
But as long as the crowd wants to play this casino – feels like it – this continues.
In the week ended Wednesday, $4.5 billion moved into SPY, the SPDR S&P 500 ETF (courtesy of ETF.com). In the same week, U.S.-based equity funds took in $7.3 billion, for a total of $37.7 billion in the past five (courtesy of Lipper). Since the election, these two attracted $21.3 billion and $52.1 billion respectively.
When the music stops, those with one foot out the door are likely to exit with ease.
Currently net long 86.6k, up 55.9k.
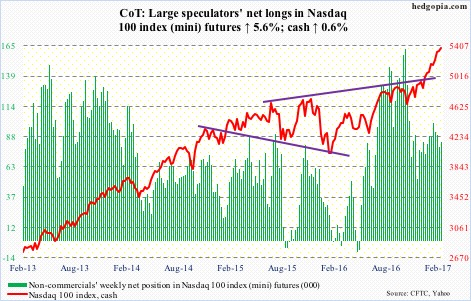
Nasdaq 100 index (mini): In the week ended Wednesday, QQQ, the PowerShares Nasdaq 100 ETF, attracted $1 billion (courtesy of ETF.com). The Nasdaq 100 (cash) jumped 1.1 percent Wednesday to a new intraday high 5398.43.
Post-election, bulls have consistently stepped up to defend 10- and 20-day moving averages. Friday, buyers showed up near the 10-day, which looks to be on the verge of at least going flat.
Currently net long 83.8k, up 4.4k.
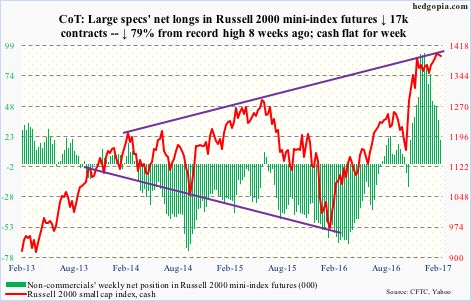
Russell 2000 mini-index: In a session that saw the cash rally two percent to a new intraday high 1414.82, IWM, the iShares Russell 2000 ETF, lost $145 million on Wednesday – part of the $481 million in outflows in that week (courtesy of ETF.com). This followed redemptions of $521 million in the prior week.
Hedge funds have been cutting back since they accumulated the most net longs early this year. Small-cap bulls hence cannot afford to lose the support of the small investor. The index is struggling to get traction, having moved sideways for 13 weeks. The weekly chart just completed a bearish MACD cross-under.
Currently net long 19.7k, down 16.8k.
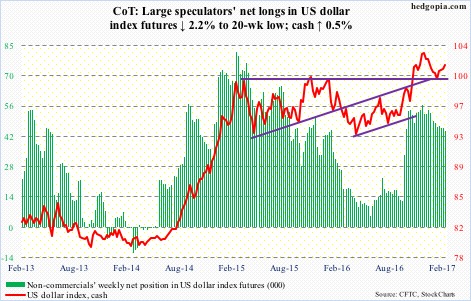
US Dollar Index: Two-year yields Thursday shot up to 1.32 percent – the highest since June 2009. The dollar index (cash) was in tow, rallying past important resistance at 102, which it lost Friday anyway. This could potentially form the right shoulder of a head-and-shoulders formation. The 50-day moving average – flat to slightly dropping – is merely 0.1 percent away. Friday’s 0.8-percent drop came in a session in which Yellen stated a March hike was likely.
Non-commercials continue to cut back net longs.
Currently net long 44.8k, down 1k.
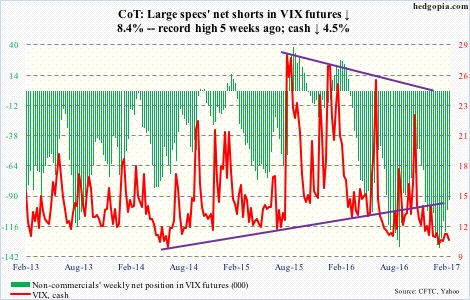
VIX: The cash stayed above the 50-day moving average in the first four sessions before giving it back on Friday – first sub-11 close in three weeks. The lower Bollinger band (daily) is 4.8 percent away.
In the meantime, the VIX-to-VXV ratio put in yet another close in the .70s. The ratio has now lingered there for eight of last nine weeks – and in 12 out of last 15.
Click on "In reply to", for Authors past commentaries
Information posted to this board is not meant to suggest any specific action, but to point out the technical signs that can help our readers make their own specific decisions. Your Due Dilegence is a must! • DiscoverGold
Register for free to join our community of investors and share your ideas. You will also get access to streaming quotes, interactive charts, trades, portfolio, live options flow and more tools.


 News
News  Market Data
  Discover