:) Energy SPDR Showing No Improvement - XLE Reaching a Decision Point By Erin Heim
* March 2, 2017
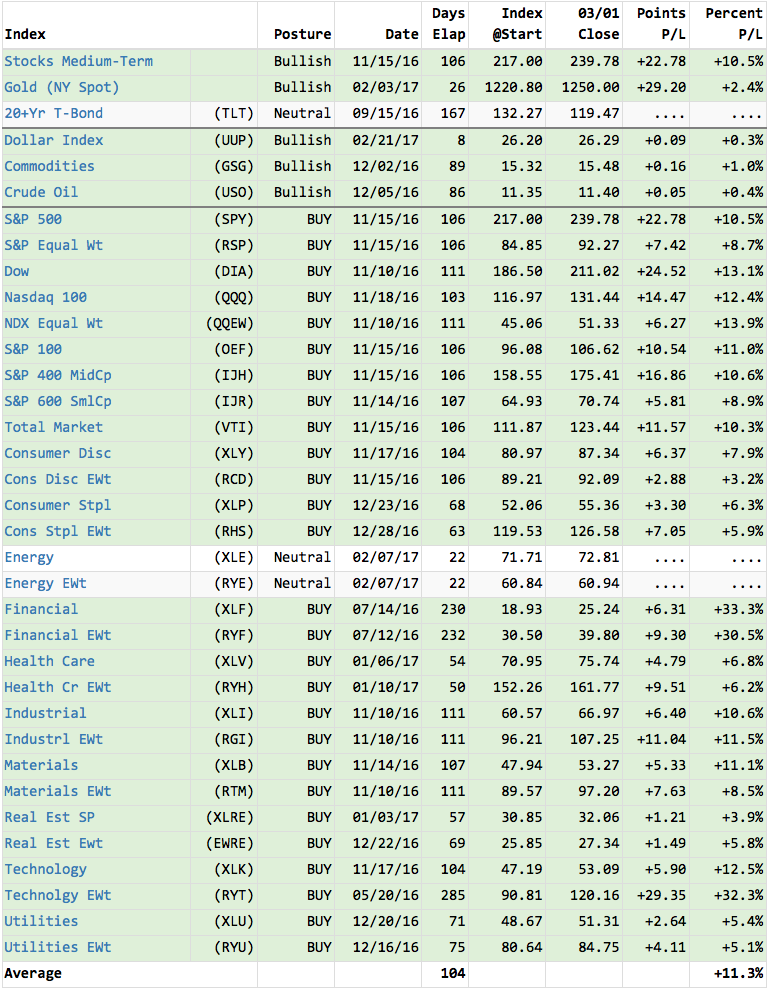
Every Wednesday and Friday, I review the DecisionPoint Market/Sector Summary with my webinar viewers. It is actually only one table that is taken from the full Market/Sector Summary found in the "DP Reports" blog. This table shows us the DecisionPoint Intermediate-Term Trend Model (ITTM) "posture" for the major indexes and sectors. Green shading is an ITTM BUY signal, red shading are ITTM SELL signals and no color is a Neutral signal.
You'll note on the table that there are no ITTM SELL signals. There actually haven't been since last year. An ITTM BUY signal is triggered when the 20-EMA crosses above the 50-EMA. So you can see that majority have 20-EMAs above their 50-EMAs. The Neutral signals are generated when the 20-EMA drops below the 50-EMA while the 50-EMA is above the 200-EMA. Think about it. If the 50-EMA is above the 200-EMA on a stock or index, it is in a bull market configuration. DecisionPoint doesn't go on SELL signals when the 50-EMAs are above the 200-EMAs.
Interestingly, Energy is the only sector struggling right now. I decided to see if it had recovered yet and was ready to switch back to a BUY signal. Well, as you can see in the daily chart below, it isn't completely recovering. It did rally with the market but it was only able to reach the declining tops trendline or the top of the declining trend channel. It was immediately turned away as it has been since January. Indicators are mixed right now on the daily chart. On-Balance-Volume (OBV) is in a positive divergence with price and the Price Momentum Oscillator (PMO) just bottomed. The price pattern is very negative, but price could reach rising bottoms intermediate-term support (in red) very soon at $70. It would likely remain in the declining trend channel when it reaches that support. The PMO is already decelerating and trying to top below its signal line. If it could put in a good bottom, there could be some good news for Energy given that the PMO is past the bottom of the recent PMO range.
The IT picture is fairly bearish given the recent PMO SELL signal triggered on this declining trend. Good news is that price is very close to support at $70. If it can rebound there, the PMO would still have room to move upward. However, seeing that SELL signal at the top of the recent range has enough bearish implications that I would expect a breakdown.
Conclusion: As I noted in today's headline, Energy is at a crossroads or decision point (pun intended) as price declines toward support at $70. Short-term indicators are somewhat bullish and are poised to support a rally off support at $70. Yet looking at the IT PMO on the weekly chart, the picture is more bearish and suggests a breakdown. Look for a decline to $70; after that, we wait for the decision at the $70 point.
Technical Analysis is a windsock, not a crystal ball.
Click on "In reply to", for Authors past commentaries
Information posted to this board is not meant to suggest any specific action, but to point out the technical signs that can help our readers make their own specific decisions. Your Due Dilegence is a must! • DiscoverGold
Register for free to join our community of investors and share your ideas. You will also get access to streaming quotes, interactive charts, trades, portfolio, live options flow and more tools.


 News
News  Market Data
  Discover