Following futures positions of non-commercials are as of February 7, 2017.
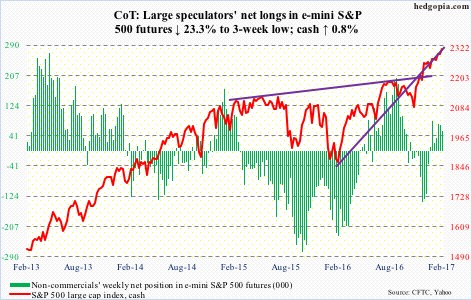
E-mini S&P 500: Yet another record on the cash … rallied Friday to an intra-day high of 2319.23. Prior to this, in the week through Wednesday, SPY, the SPDR S&P 500 ETF, lost $3 billion (courtesy of ETF.com). That said, in the same week, $2.4 billion moved into U.S.-based equity funds, following $13.8 billion in inflows in the prior week (courtesy of Lipper). Post-Nov 8 election, these funds have attracted north of $30 billion, and SPY $15.1 billion.
The election has given birth to giddy expectations.
Investors Intelligence bulls have come in north of 50 in the last 12 weeks, with four out of the last six in the 60’s.
As overbought as the cash is, buyers have so far been ably defending the shorter-term moving averages. As things stand, odds are stacked against shorts until these averages roll over. The cash has been rallying along a rising trend line from the lows of February last year.
Currently net long 54.3k, down 16.5k.
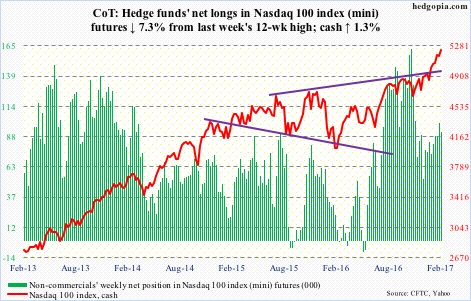
Nasdaq 100 index (mini): Apple (AAPL) boasts of a daily RSI (14) of 87.2! This pretty much sums up the state of affairs on the Nasdaq 100 (cash). It is already up north of 7.5 percent year-to-date. Rather astonishingly, it has rallied in the face of outflows of $1.2 billion this year from QQQ, the PowerShares Nasdaq 100 ETF. In the week ended Wednesday, $819.1 million was withdrawn (courtesy of ETF.com).
With that said, momentum is intact. In 2017, only once has the cash closed below the 10-day moving average, which, along with the 20-day, is still rising. Bears need to force them lower to get any traction.
Currently net long 92.4k, down 7.3k.
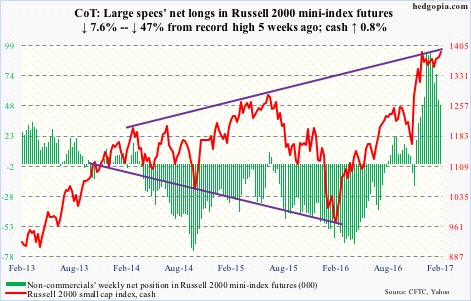
Russell 2000 mini-index: Nine and counting. That is the number of weeks the cash has gone sideways in a rectangle/flag formation. For as long as this consolidation has taken place, a break either way will be significant. Particularly so as this is one of the major U.S. indexes yet to post a fresh new high. The December 9 high of 1392.71 stands.
Friday, the cash closed right underneath that resistance. This is as good a chance as any for small-cap bulls to force a breakout next week. We will see. On the weekly chart, there has been back-to-back hanging man (potentially bearish).
Flows have been off and on, and this is not what the bulls want. In the week ended Wednesday, $1.1 billion left IWM, the iShares Russell 2000 ETF (courtesy of ETF.com).
Currently net long 49.1k, down 4k.
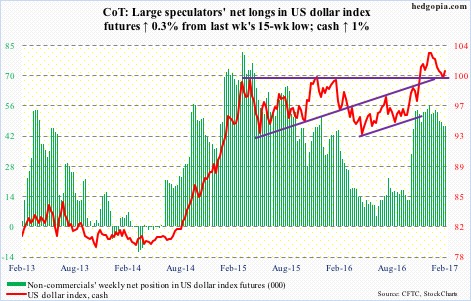
US Dollar Index: The cash did not quite test a rising trend line from last May, but did retrace 38.2 percent of the May 3, 2016-January 3, 2017 rally when it dropped to 99.20 on February 2. This area also held three-month horizontal support.
The subsequent rally understandably is struggling at resistance going back to March 2015. The dollar index broke out of it last November, followed by a drop underneath last month. What happens here will be a big tell.
There is room for weekly conditions to continue to head lower. At the same time, they have reached the median. In the current context, there is no better place for dollar bulls to step up and force theses indicators up, if they could.
Currently net long 46.7k, up 161.
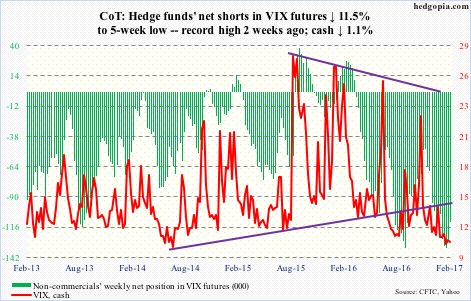
VIX: Sub-11 again – third straight weekly close with a 10 handle. This followed an intraday drop last week to 9.97 – the lowest since February 2007. As suppressed as these levels are, volatility continues to meander along the lower end of years-long range. Daily moving averages – 10, 20 as well as 50 – are all going flat. For volatility to begin to have legs, these averages need to start moving up.
Along the same lines, this was the sixth straight week – and in 10 out of last 12 – the VIX-to-VXV ratio lingered in the .70s – way oversold, and in need of unwinding.
Click on "In reply to", for Authors past commentaries
Information posted to this board is not meant to suggest any specific action, but to point out the technical signs that can help our readers make their own specific decisions. Your Due Dilegence is a must! • DiscoverGold
Register for free to join our community of investors and share your ideas. You will also get access to streaming quotes, interactive charts, trades, portfolio, live options flow and more tools.


 News
News  Market Data
  Discover