


BY GREG GUENTHNER POSTED FEBRUARY 10, 2017
https://dailyreckoning.com/fix-biggest-trading-weakness/
“Use your brain” might just be bad investment advice.
That’s right, Einstein – it’s possible to think too much when it comes to trading.
Sometimes we can’t help ourselves. Human curiosity gets the best of us and we get caught up in why and forget about what.
The Super Bowl Indicator, the goofy stock market indicator that we talked about last week before the big game, is obviously bogus. Correlation doesn’t equal causation. Look past the surface stats and the indicator starts to fall apart.
But sometimes, false reasons for market stats are less clear.
That brings me to an email that reader Joe P. sent in after I shared stats showing that Pentair (NYSE:PNR) has a seasonally strong market pattern between January and May…
Read article on Pentair today. Easily explained. Pentair rallies from January to May every year because that is when most all folks put in pools. Pentair is one of, if not the, largest manufacturers of pool pumps and filtration equipment in the country.
Don’t be so sure.
I passed this note along to our resident statistician Jonas Elmerraji. I figured he would have plenty to say about this reader’s theory…
“Yes, Pentair is a big manufacturer of pool equipment. But that makes up a teeny piece of their overall business,” Jonas says. “It’s kind of like saying that multinational conglomerate General Electric is going to rally this summer because they’re going to sell a bunch of GE-branded air conditioners. They’re just not a meaningful piece of the total company.”
Fair enough. Pool season may correlate with Pentair’s bullish price trend, but it’s not causal.
“I can’t fault Joe for suggesting it, though. We see this all the time in the financial markets from retail investors and professionals alike,” Jonas explains. “People look for reasons behind stock market moves, even when there aren’t any.”
There are plenty of examples in the financial pages now that we’re smack in the middle of earnings season…
If a stock moves up a little bit following earnings, the financial journalists say that it’s because earnings exceeded expectations. But if that stock slides into negative territory later in the day, the next story laments that shares are down because earnings missed expectations.
“Fight the urge to try and explain the drivers behind statistical patterns in stock prices,” Jonas concludes. “More often than not, it doesn’t boil down to a single driver. Instead, markets are incredibly complex mechanisms. Stock prices have fundamentals, biases, speculations and macro factors all baked in, plus noise.”
The fact of the matter is that it’s incredibly difficult to separate out those individual components most days…
The good news is that you don’t need to filter it all to make money from statistical patterns.
Because Jonas analyzes patterns in the price action itself, all he needs to care about is that a pattern exists and it’s statistically valid. That’s enough to make money from it.
Nobody can guess what’s going to happen next for stocks. That’s impossible. Instead, what we’re talking about are high-probability trades. We’re looking for stocks that are more likely to go up than go down. Simple as that…
In fact, Jonas has agreed to share one of these trading ideas with us today.
Check out Hasbro Inc. (NYSE:HAS):
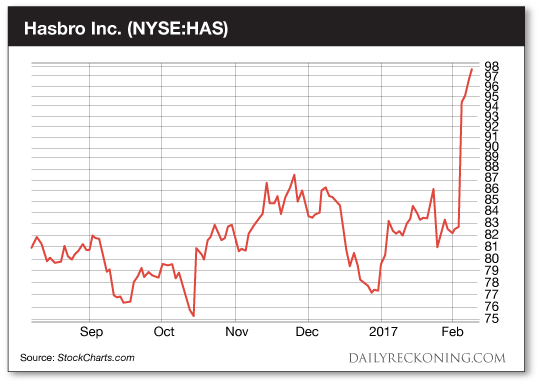
“This toymaker isn’t playing games,” Jonas says. “Shares broke out at the start of this week following earnings, and they’ve been holding onto new highs ever since. Part of the fuel behind that up-move was this stock’s seasonal pattern, which starts on February 2 and lasts until April 6. Hasbro basically stays in rally mode every year for 64 calendar days in total.”
The pattern has worked for the last 23 straight years with an 87% win rate, Jonas notes. Average gains are well into the double-digits. That suggests there’s upside left in this stock after Monday’s earnings move.
Critically, by running the stats on these plays, we know immediately when a trade starts to unravel. In Hasbro’s case, the average drawdown on a successful trade is under 5% — if HAS gives back 5%, then it’s time to exit this trade. Consider parking a stop at $91 if you decide to play Hasbro’s momentum this February…
Sincerely,
Greg Guenthner
for The Daily Reckoning
Join the InvestorsHub Community
Register for free to join our community of investors and share your ideas. You will also get access to streaming quotes, interactive charts, trades, portfolio, live options flow and more tools.

